Phase 1 — Azure environment preparation and honeypot exposure
The lab began by confirming that the Azure subscription could support the full SOC pipeline: virtual
machines, networking, Log Analytics, and Microsoft Sentinel. Once readiness was confirmed, a Windows
honeypot VM was deployed and intentionally exposed to the internet to invite automated attacks.
1.1 — Verifying subscription and core security services
Before deploying any resources, the subscription was validated to ensure access to necessary
services. This ensured the honeypot would be able to send logs to Log Analytics and Sentinel
without hitting quota or configuration roadblocks mid-lab.
- Confirmed VM, networking, and monitoring resource providers were registered
- Checked subscription quotas for cores and public IP addresses
- Verified Microsoft Sentinel and Log Analytics availability in the chosen region
- Ensured billing and permissions supported a short-term SOC lab
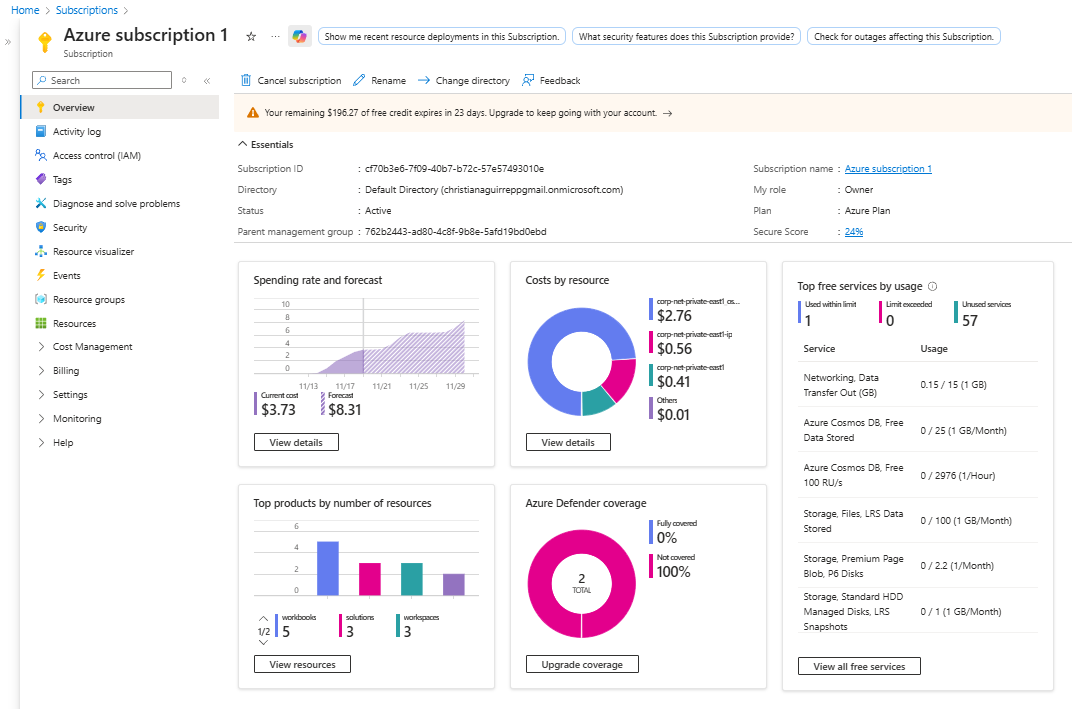
Azure subscription overview confirming quotas and eligibility for the SOC lab resources.
1.2 — Deploying the Windows honeypot VM
With the subscription validated, a Windows 10 VM was deployed as the honeypot. RDP was enabled
and assigned a public IP so that attackers could discover the host quickly using common
internet-wide scanning techniques.
- Provisioned Windows VM in a dedicated resource group for the lab
- Assigned a static public IP and enabled RDP for remote access
- Documented host details for later KQL filtering and workbook visuals
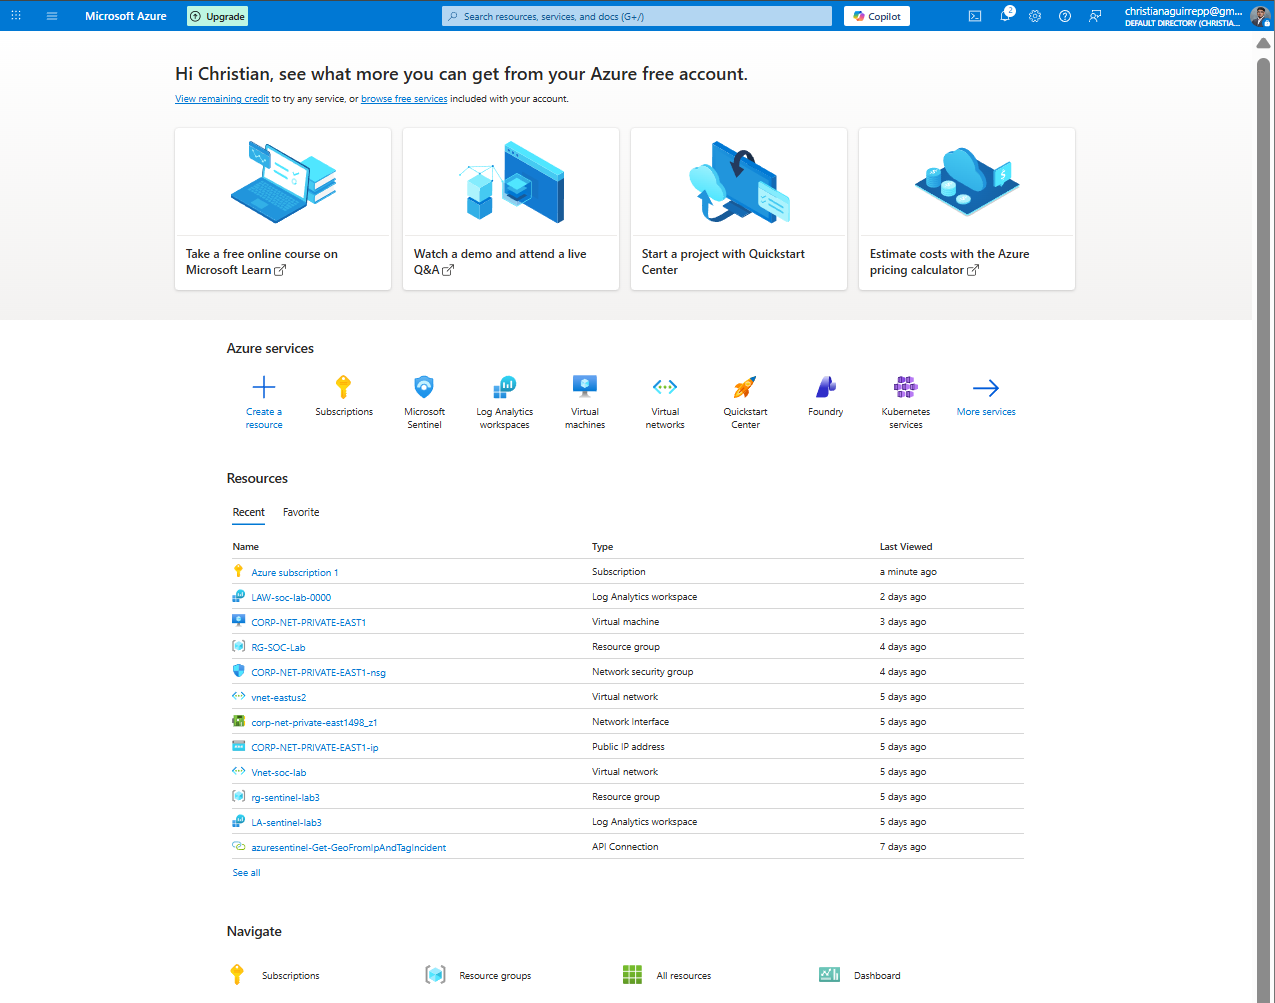
Azure portal home view showing core services used to build the honeypot environment.
1.3 — Intentionally exposing the honeypot to internet scanners
To ensure a steady stream of brute-force attempts, the network and host security controls were
deliberately relaxed. This transformed the VM from a hardened host into a noisy, attractive
target for automated RDP attacks.
- Configured NSG rules to allow inbound traffic from any source
- Disabled all Windows firewall profiles on the honeypot VM
- Created a weak decoy account to generate early failed logons
- Monitored for first external connection attempts to confirm visibility
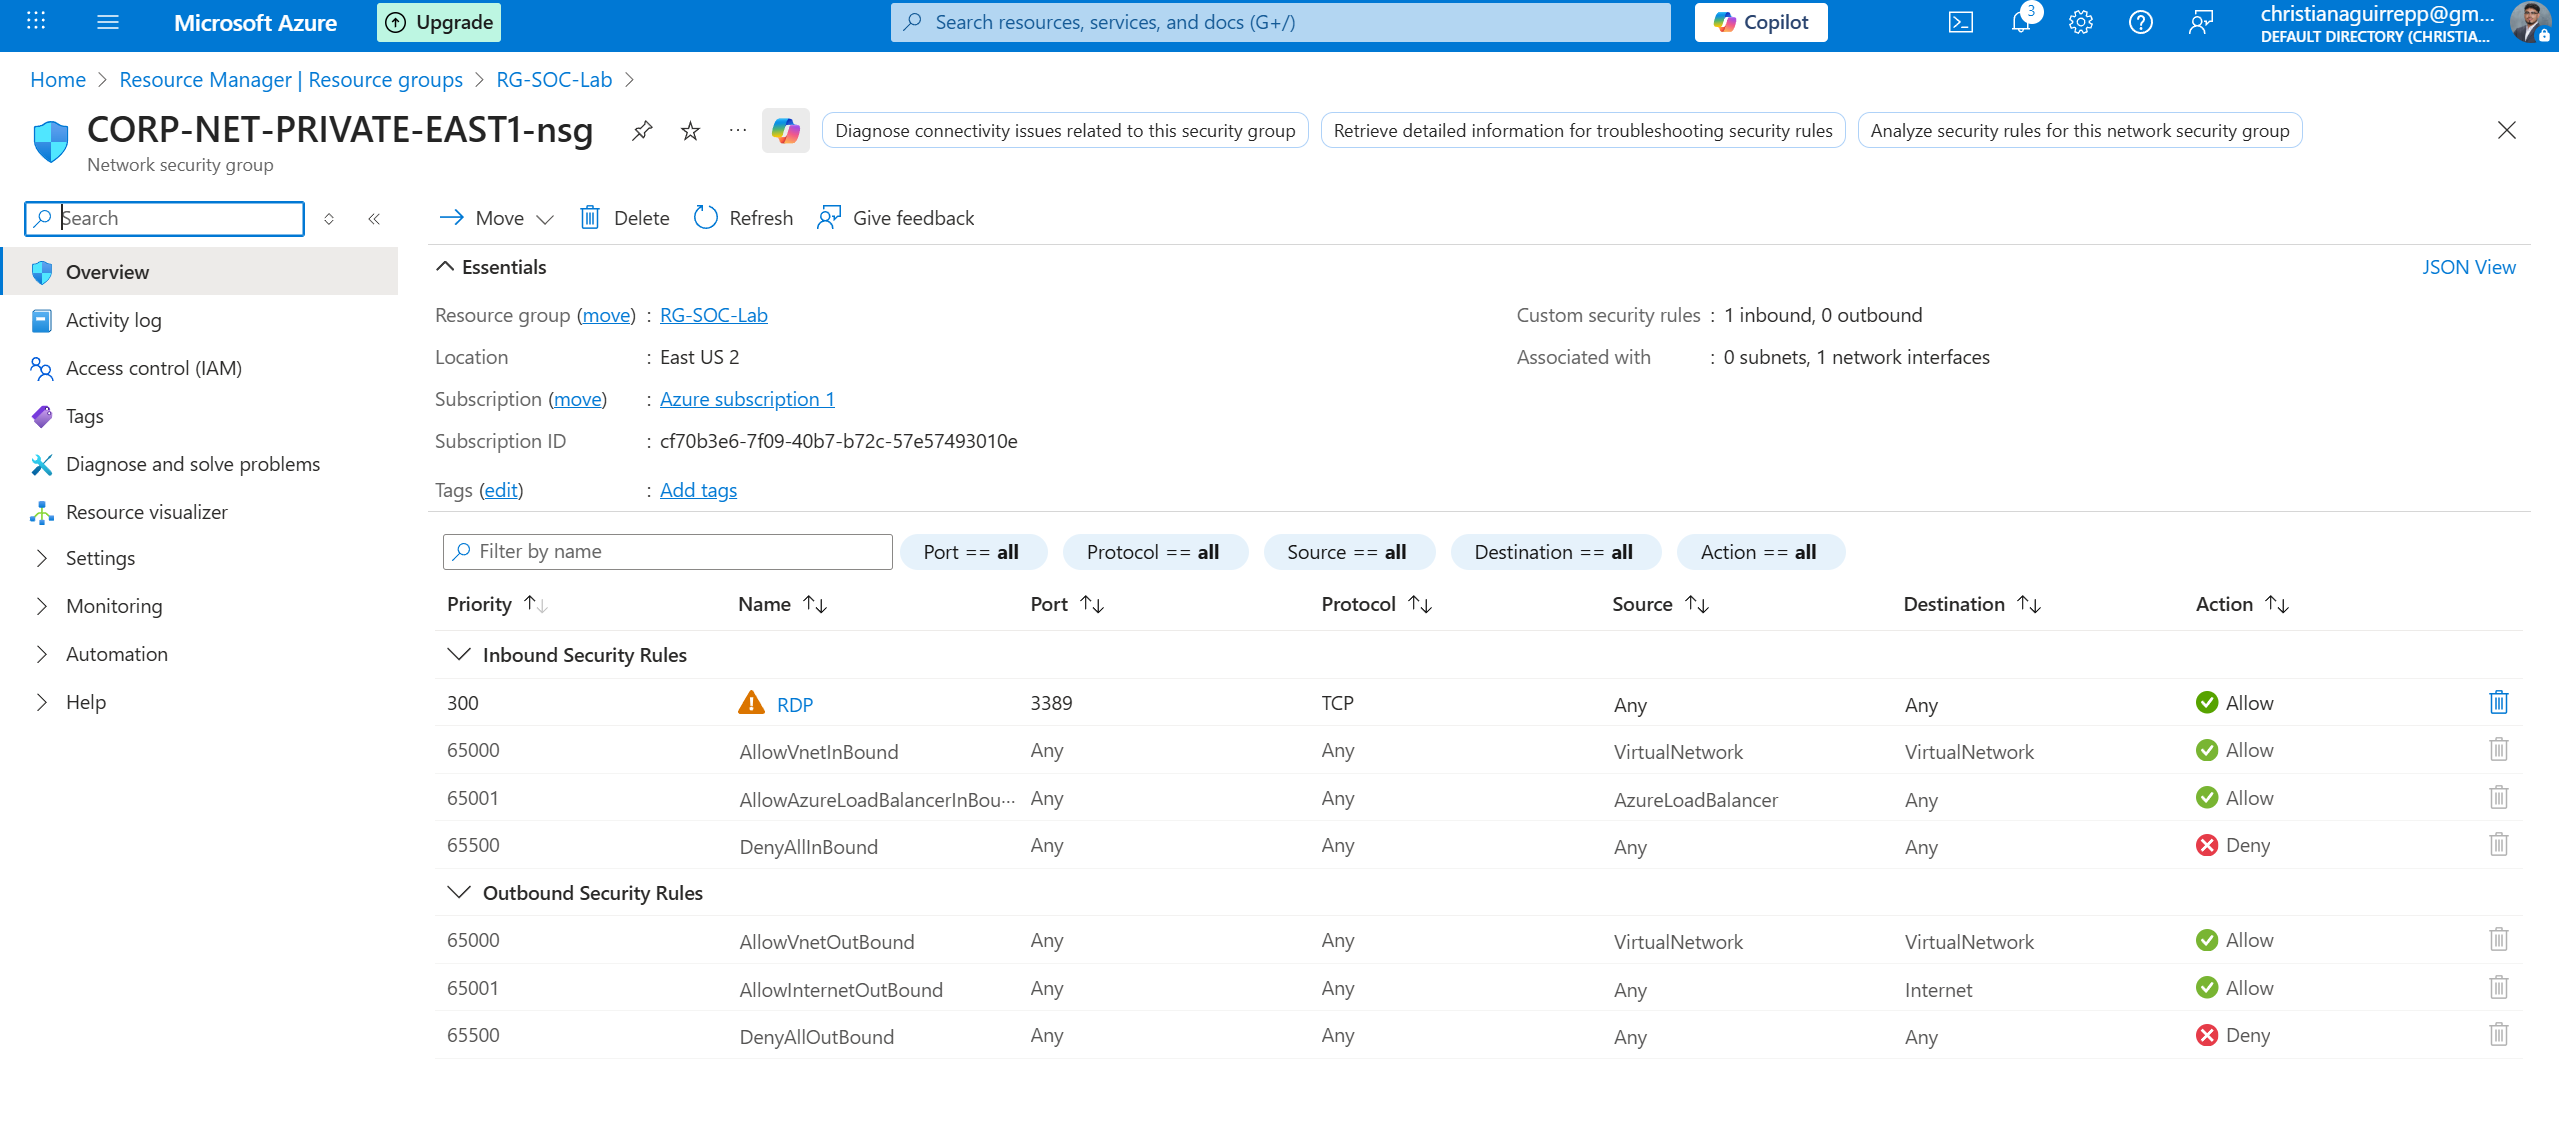
NSG configuration intentionally allowing all inbound traffic to the RDP honeypot.
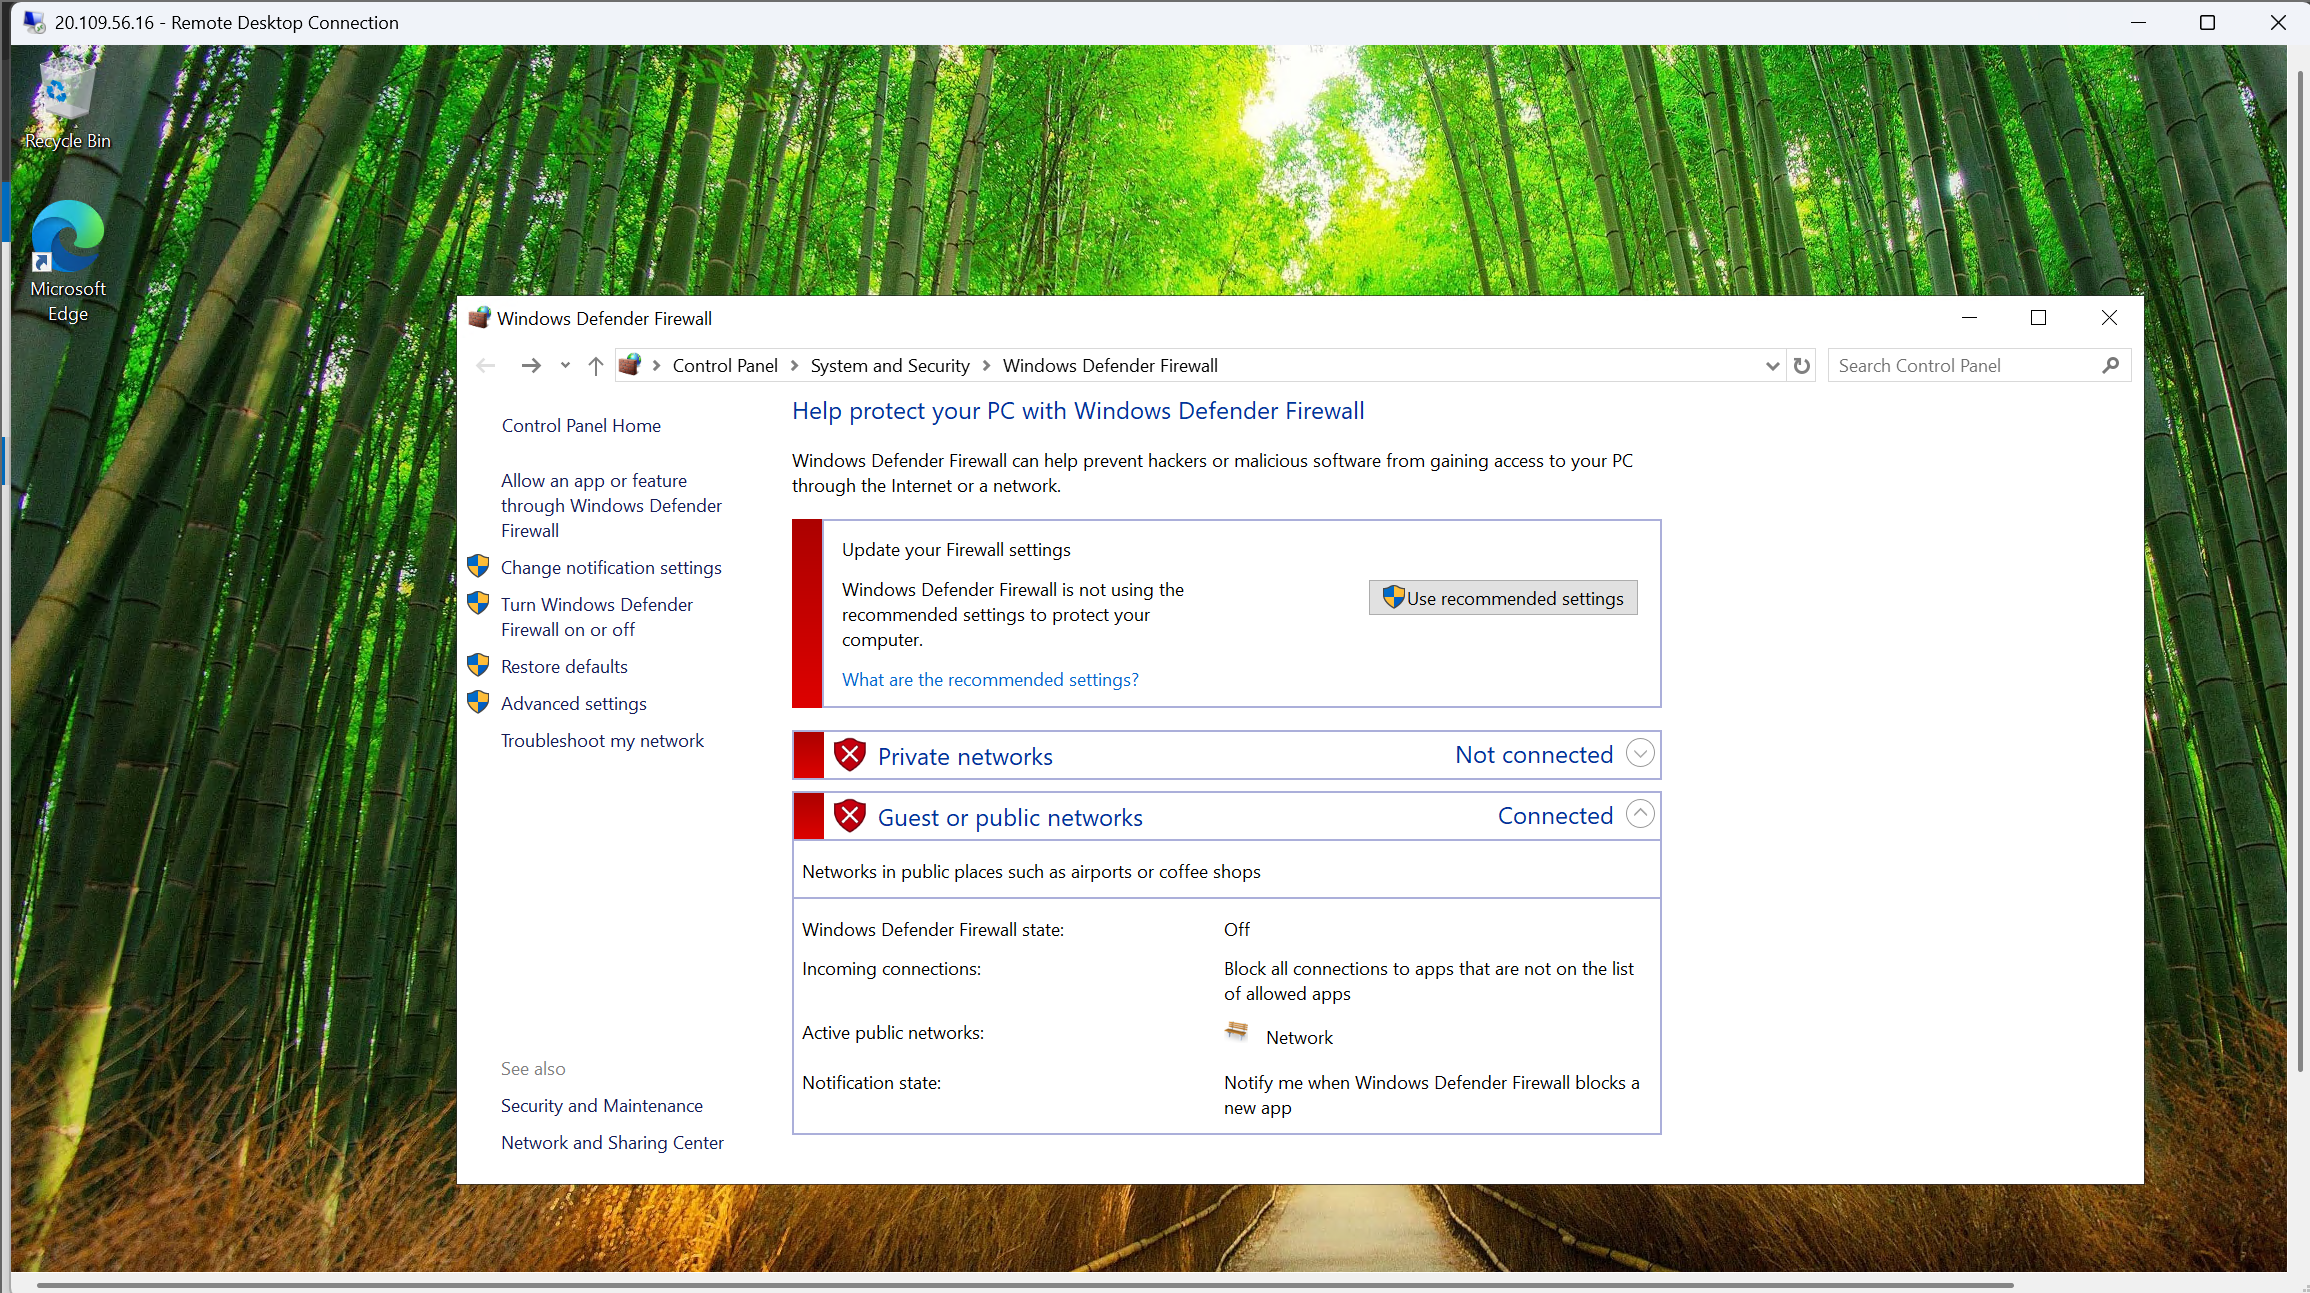
Windows firewall disabled to maximize host visibility to external scanners.
Phase 2 — Log forwarding and Microsoft Sentinel integration
Once attackers began probing the honeypot, the next step was to capture its telemetry. A Log Analytics
workspace and Microsoft Sentinel instance were configured to ingest Windows SecurityEvent logs using the
Azure Monitor Agent, creating a central SOC view of all failed logons.
2.1 — Building the monitoring foundation: Log Analytics and Sentinel
A dedicated Log Analytics workspace served as the central log repository for the honeypot. Microsoft
Sentinel was then enabled on top of this workspace, providing SIEM capabilities and analytics for
the incoming SecurityEvent stream.
- Created a Log Analytics workspace specifically for the honeypot lab
- Enabled Microsoft Sentinel on the workspace for SOC-style analysis
- Linked the workspace to the resource group containing the honeypot VM
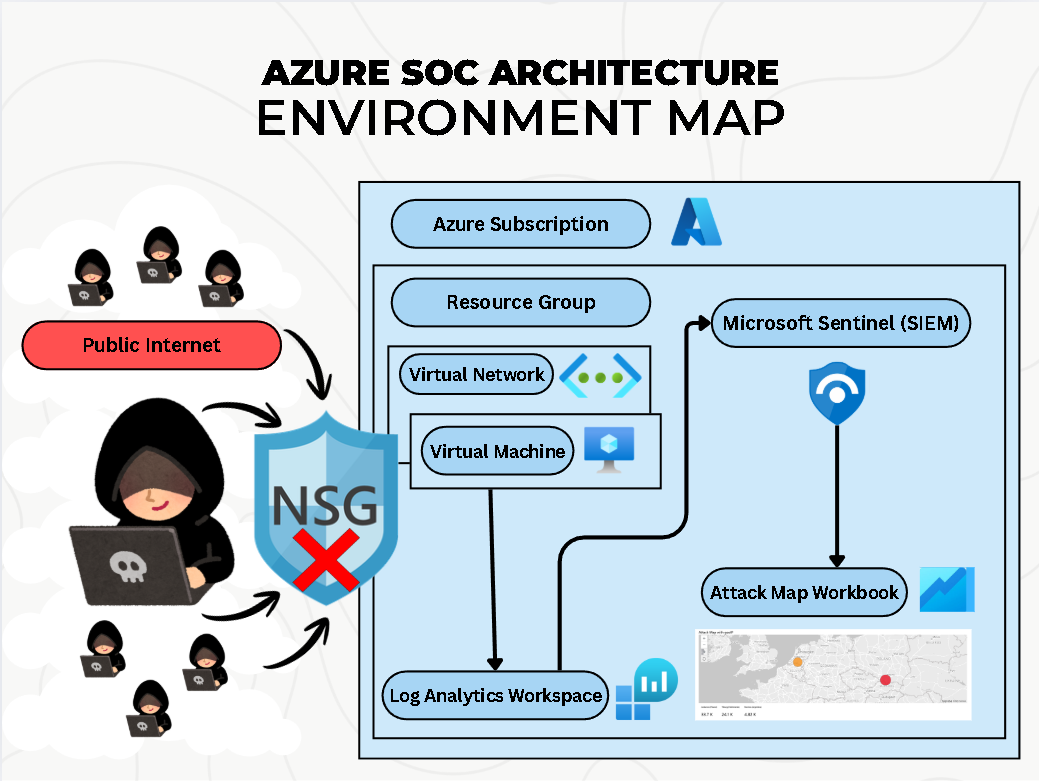
Architecture diagram showing the full honeypot pipeline from VM to Log Analytics and Sentinel.
2.2 — Connecting Windows Security logs via Azure Monitor Agent
The Azure Monitor Agent (AMA) and the "Windows Security Events via AMA" connector were used to
securely stream SecurityEvent logs from the honeypot into Log Analytics. This created a continuous
data feed of failed RDP attempts for Sentinel to analyze.
- Configured the Windows Security Events via AMA data connector in Sentinel
- Installed AMA on the honeypot VM using the recommended extension
- Verified that SecurityEvent data started populating the workspace
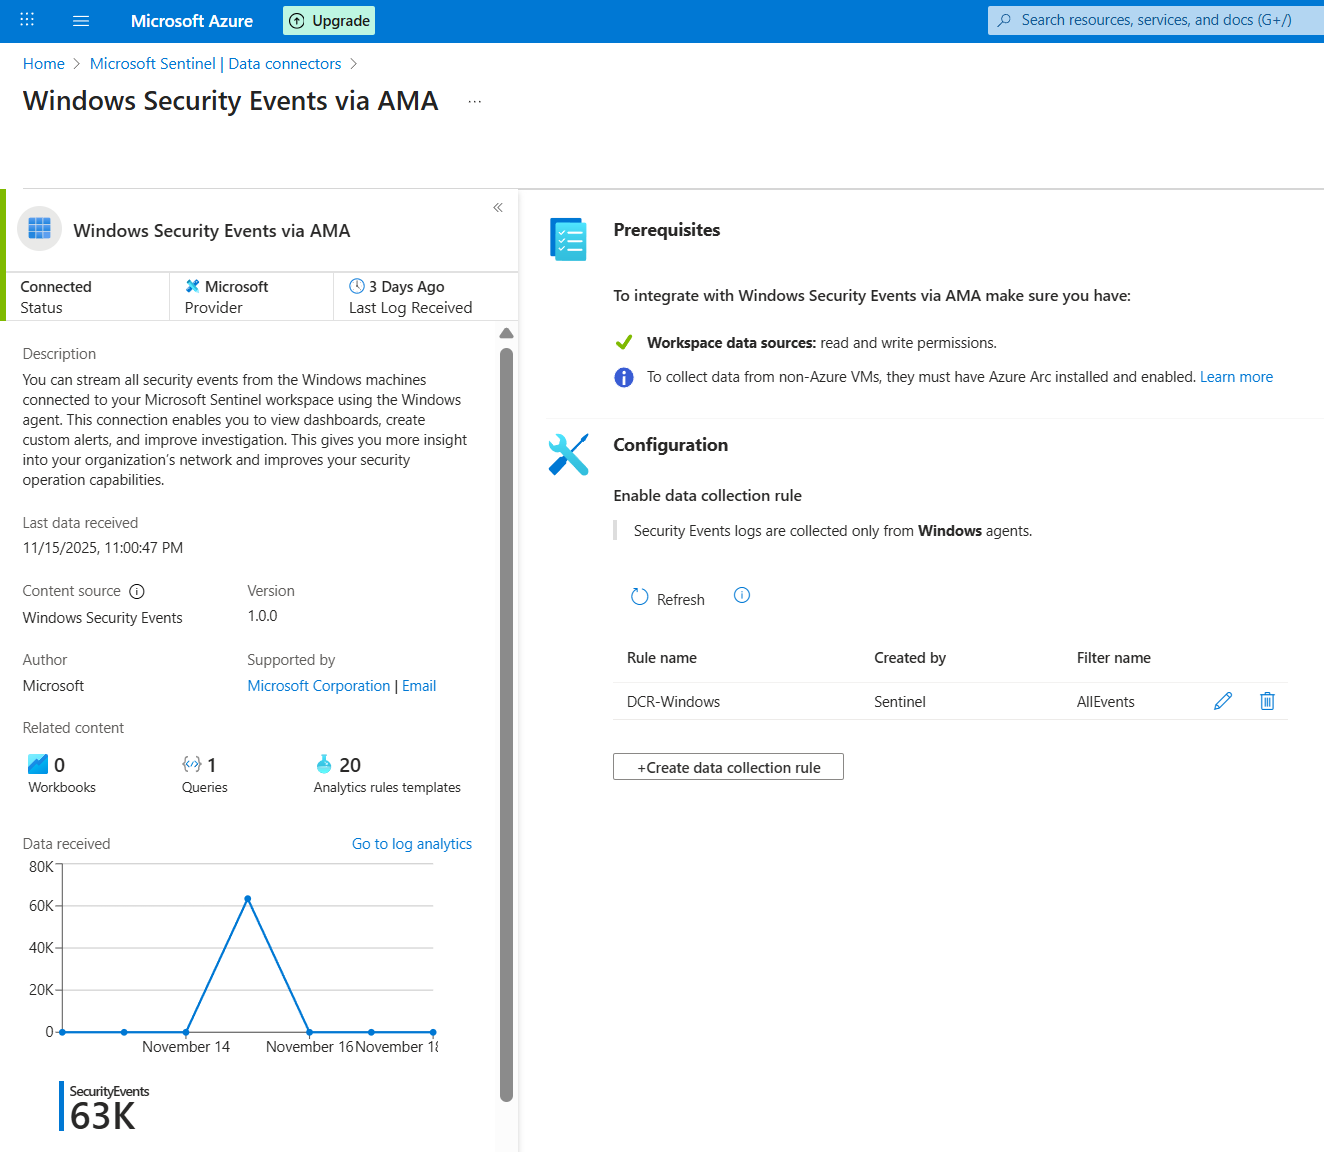
AMA connector in Sentinel showing a healthy, connected Windows honeypot source.
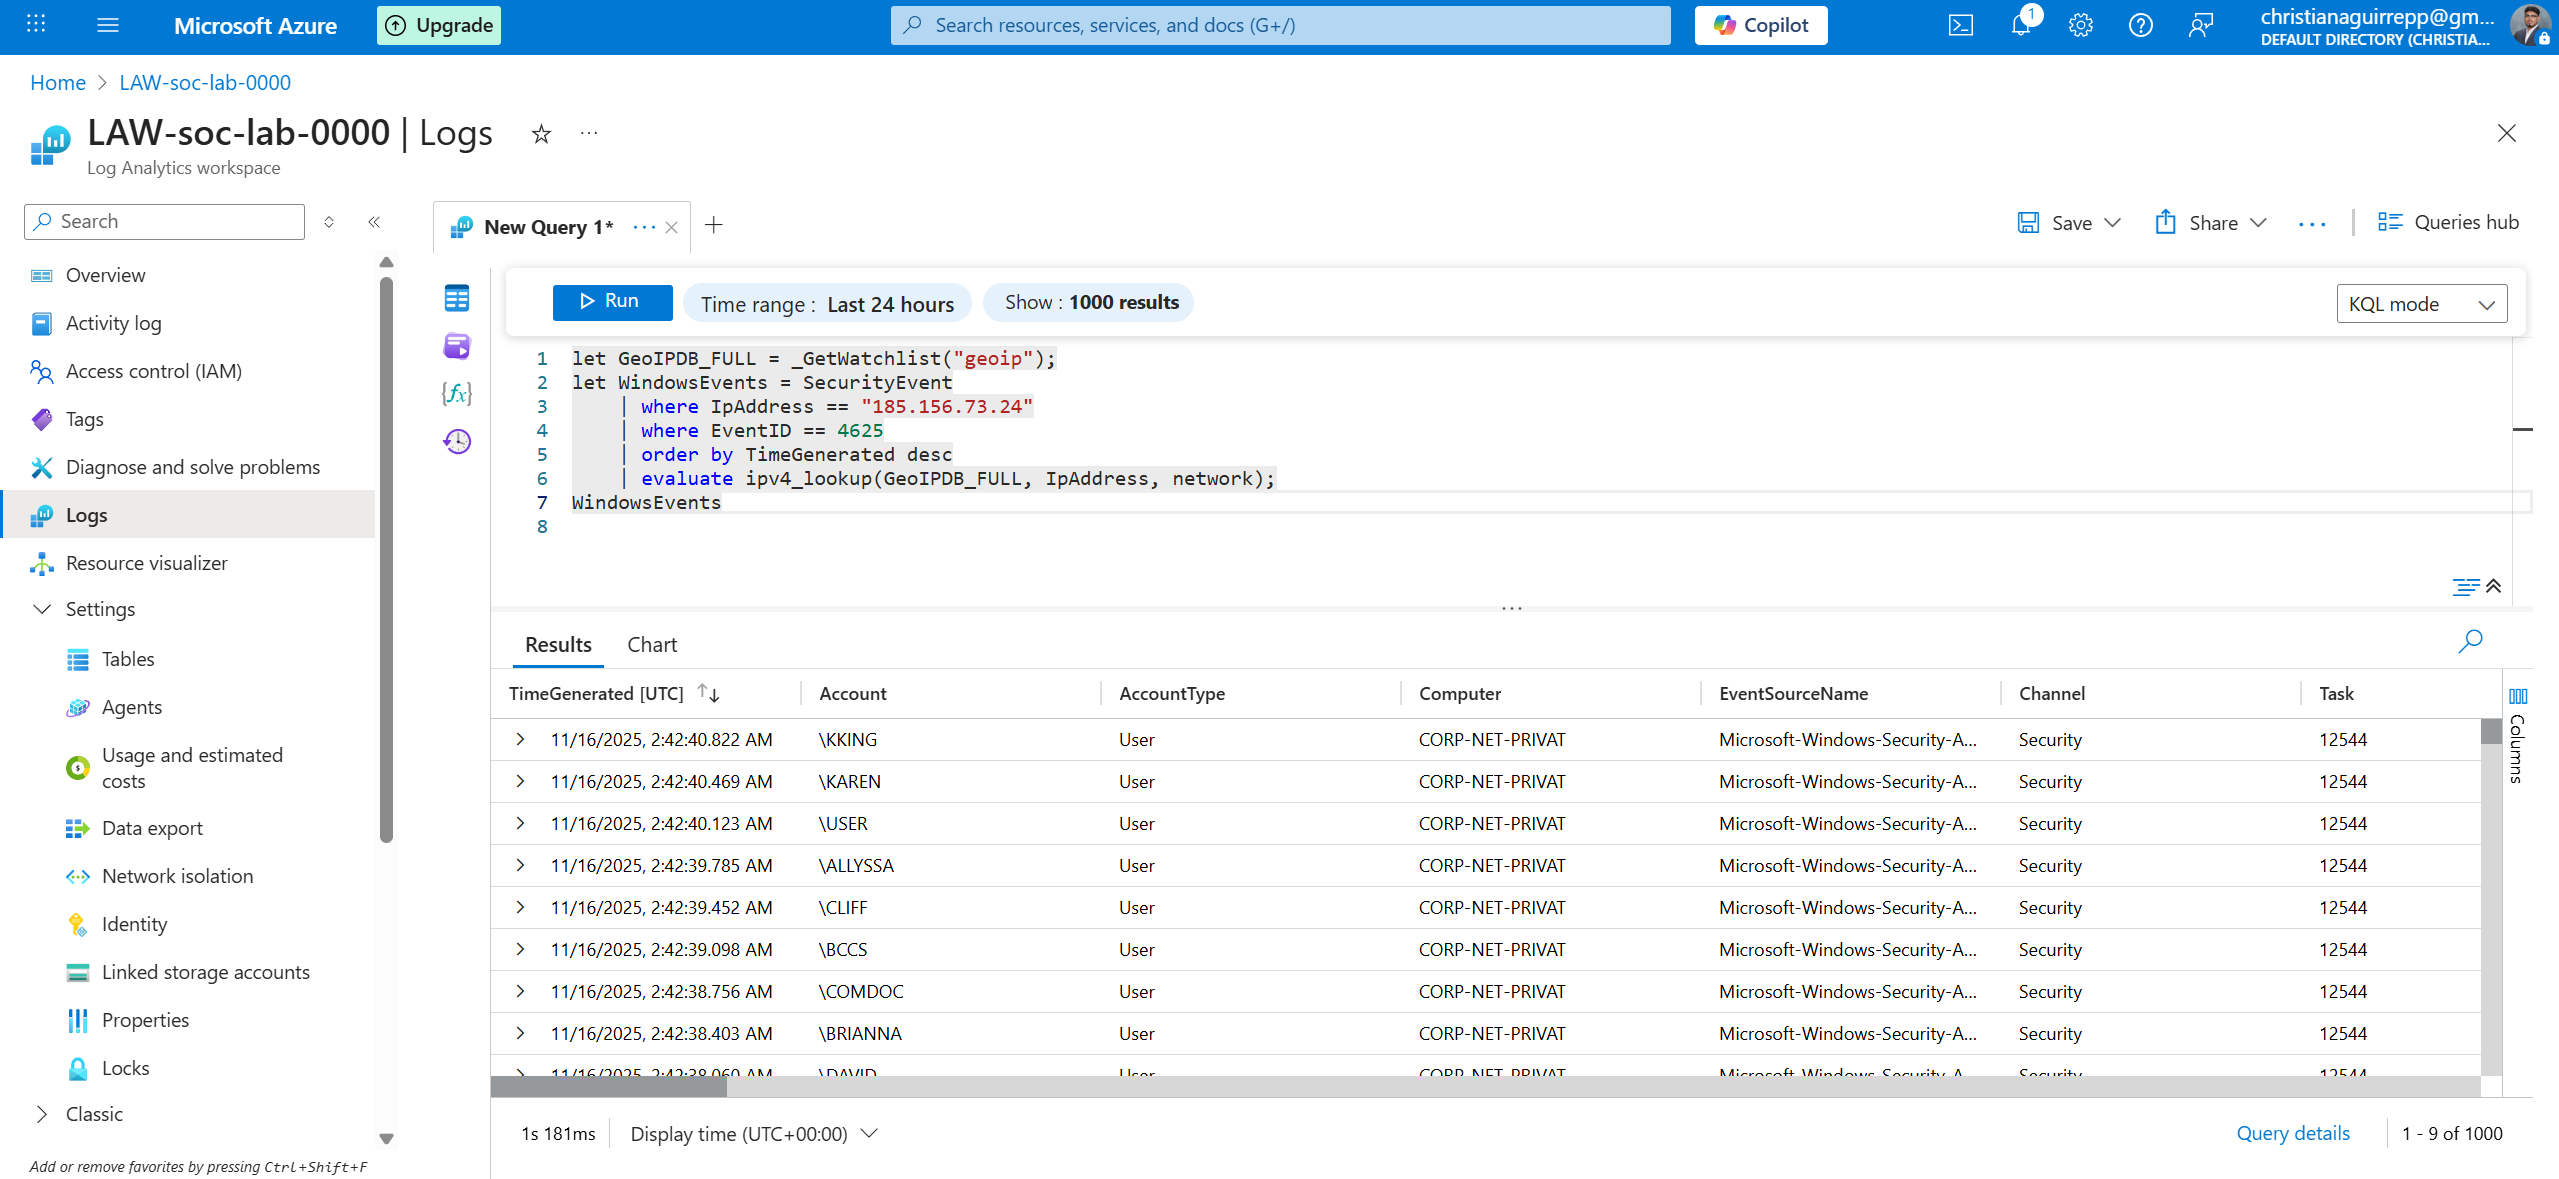
2.3 — Inspecting raw attacker telemetry in Log Analytics
With the data pipeline active, Log Analytics was used to inspect raw failed-logon events. Event
ID 4625 became the primary signal for outbound analysis, representing failed RDP authentication
attempts against the honeypot.
- Queried the SecurityEvent table for Event ID 4625
- Confirmed a rapid increase in failed logons after exposure
- Validated key fields such as IpAddress, TargetUserName, and TimeGenerated
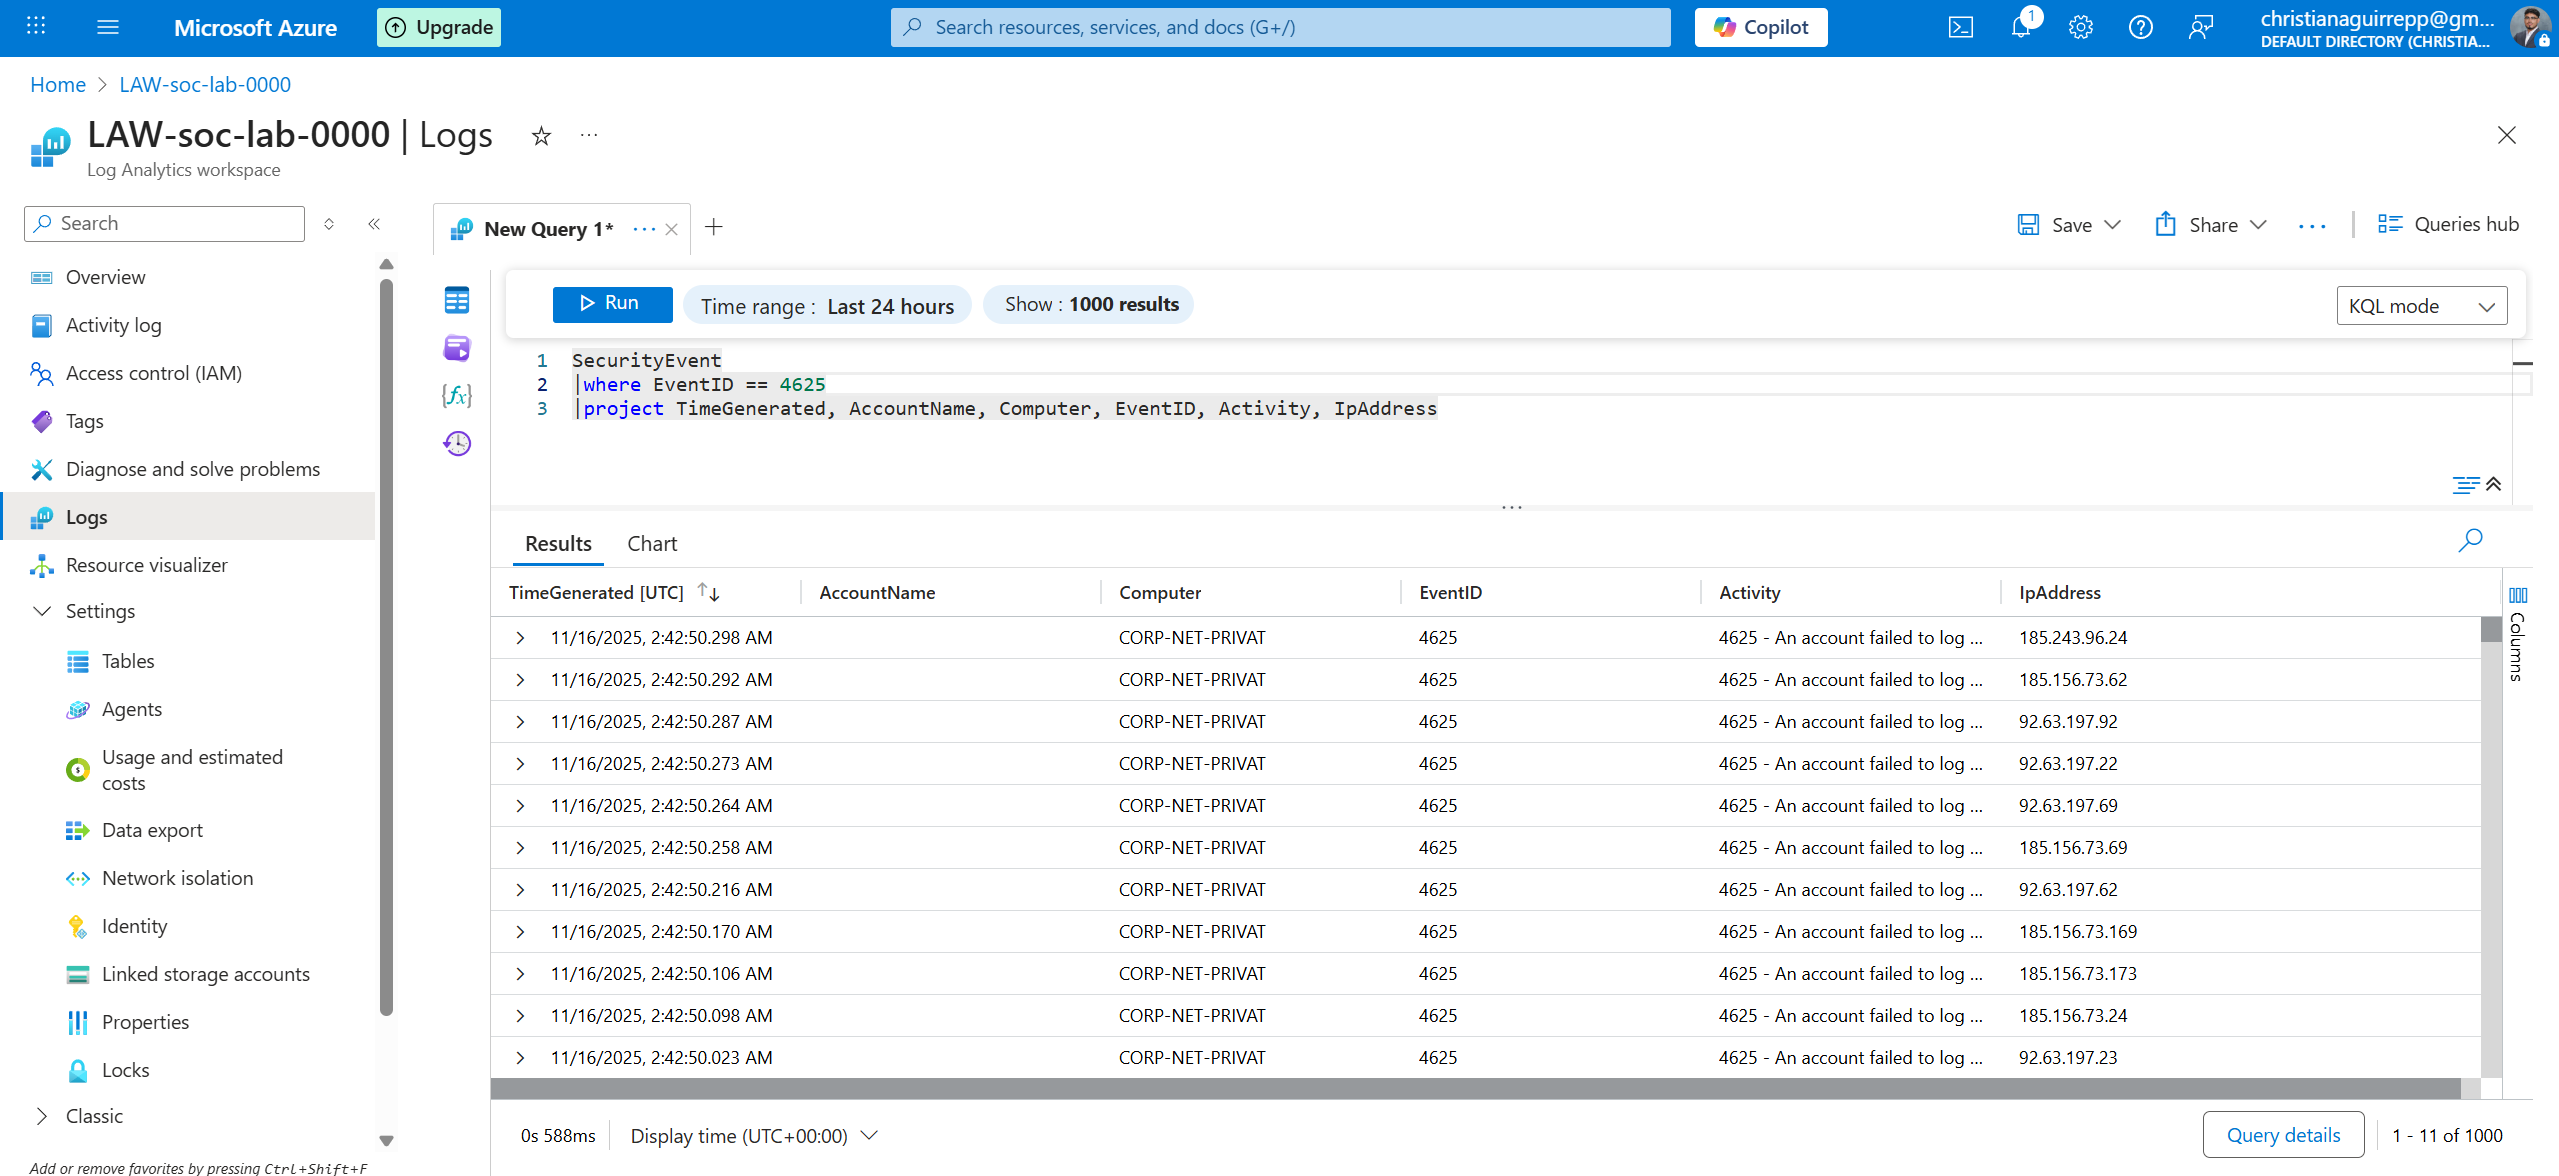
SecurityEvent logs in Log Analytics showing repeated failed RDP attempts against the honeypot.
Phase 3 — GeoIP watchlist creation and KQL enrichment
IP addresses by themselves are difficult to reason about at a glance. To make the attack data more
meaningful, a GeoIP CSV was imported as a Sentinel watchlist and KQL was used to enrich each failed
logon with country and region information, preparing the dataset for map-based visualization.
3.1 — Building the GeoIP watchlist
A GeoIP CSV containing IPv4 ranges and geolocation attributes was uploaded as a Sentinel
watchlist. This allowed KQL to rapidly map attacking IPs to their geographic context using a
single lookup operation.
- Prepared a CSV of IPv4 ranges with country, region, latitude, and longitude
- Imported the CSV into Sentinel as a watchlist named
geoip
- Verified column mappings for IP ranges and location fields
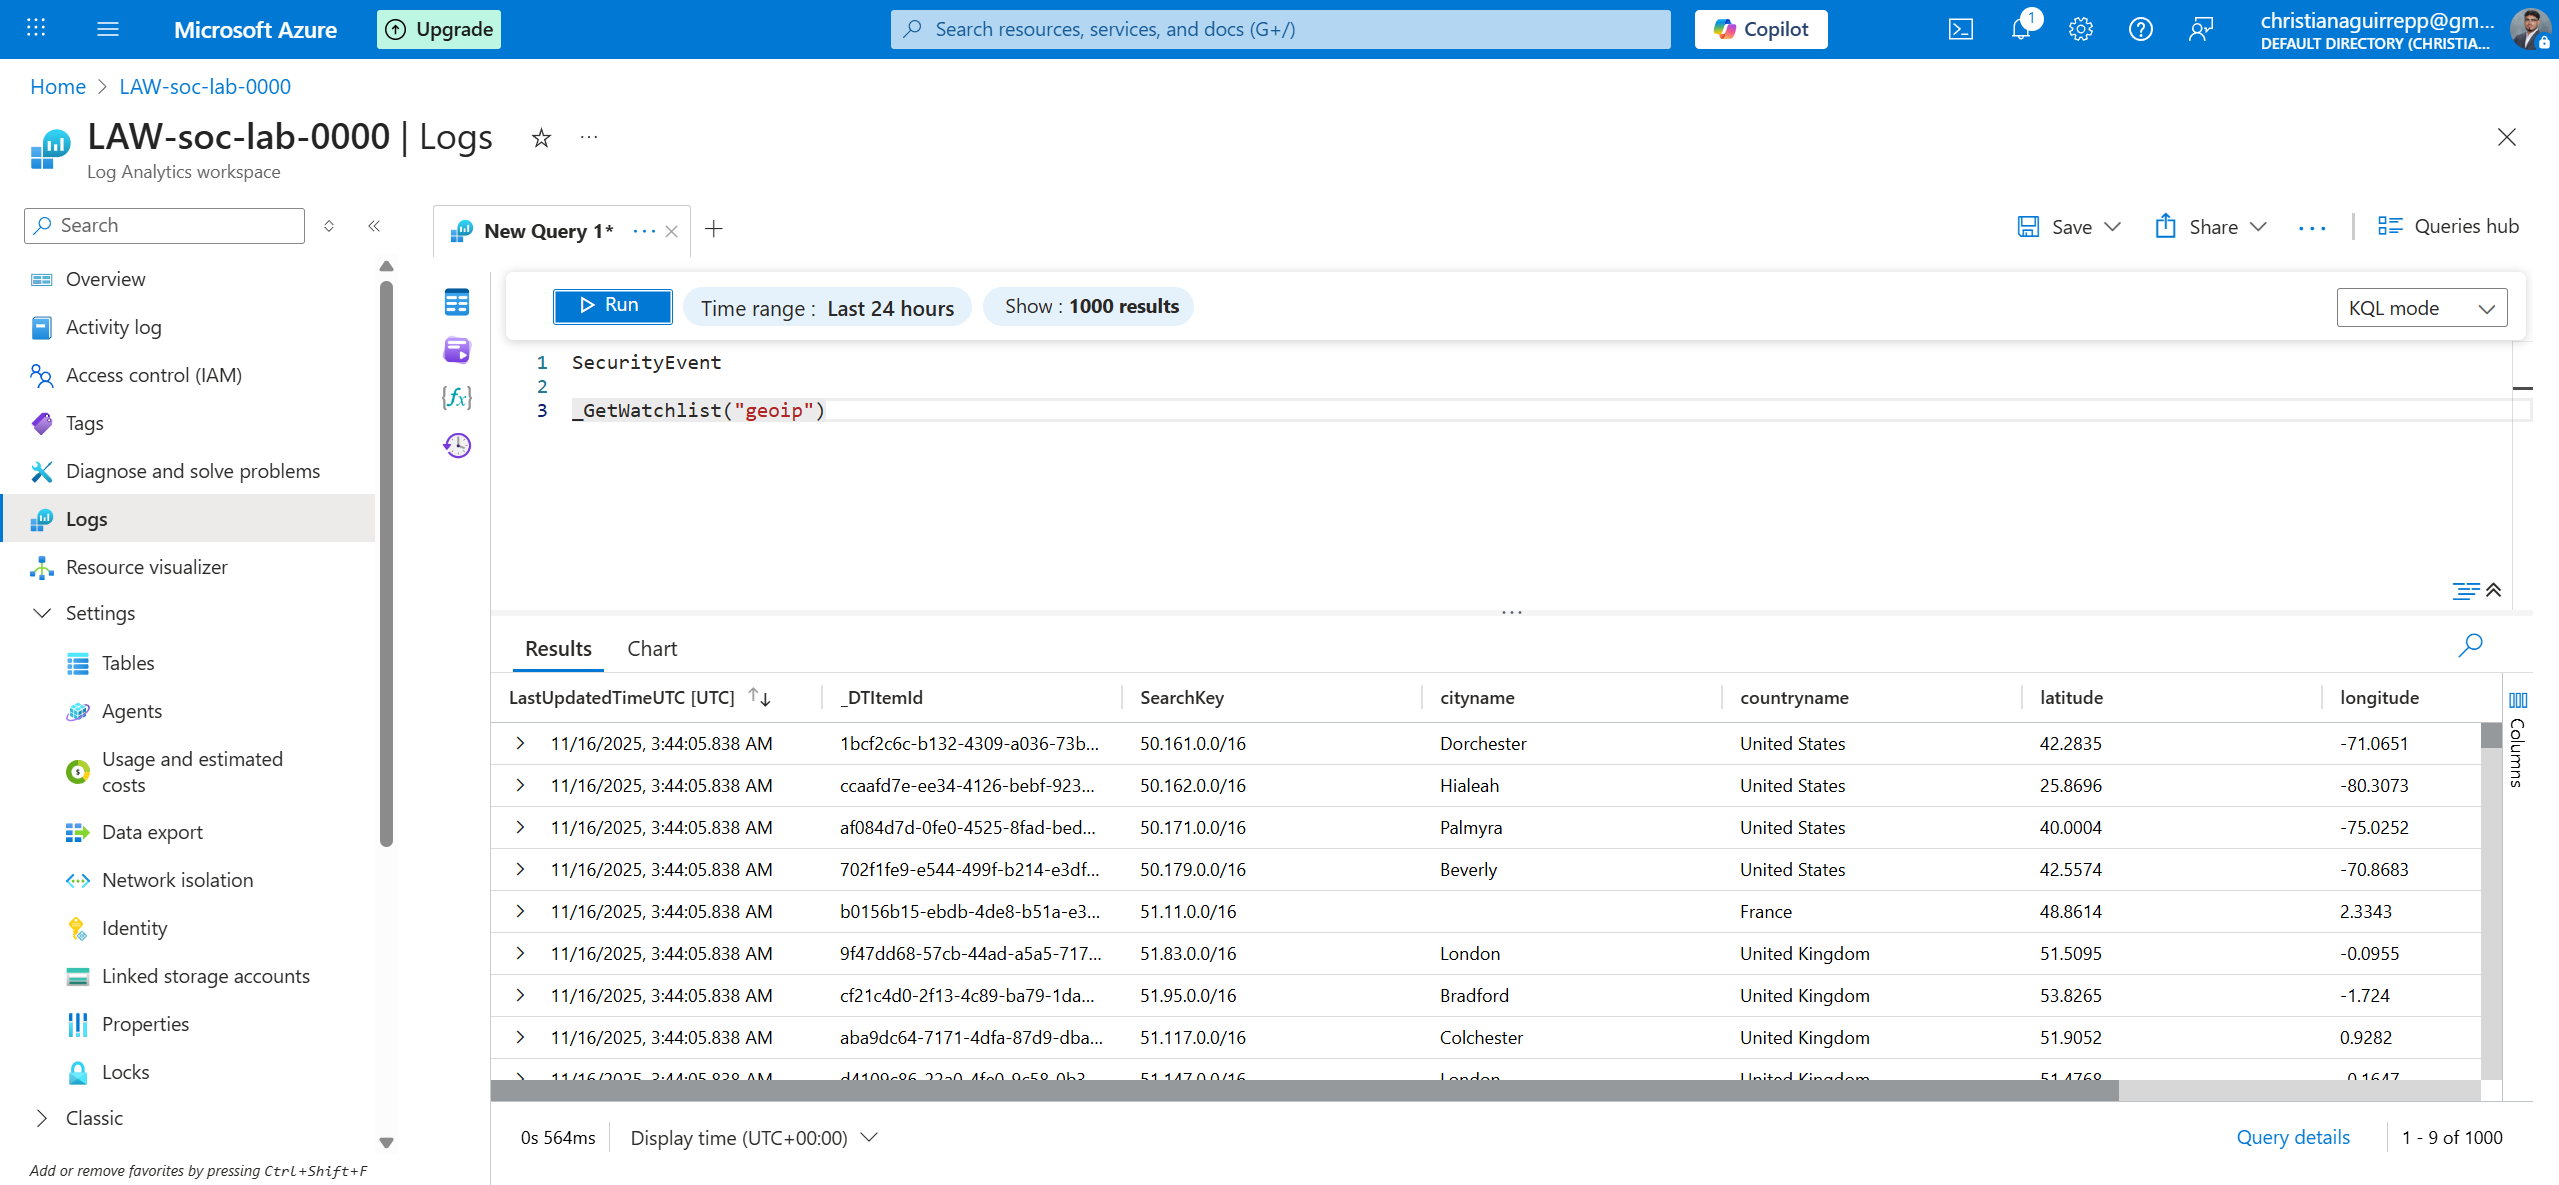
GeoIP watchlist loaded into Sentinel, ready to be joined with attacker IP telemetry.
3.2 — Enriching failed-logon events with GeoIP data using KQL
KQL's ipv4_lookup function was used to join SecurityEvent rows with the GeoIP
watchlist. This produced a new table where each Event ID 4625 record was augmented with its
corresponding country, region, and coordinates.
- Filtered SecurityEvent to only failed logons (
EventID == 4625)
- Evaluated
ipv4_lookup() against the geoip watchlist
- Produced a clean, enriched attacker table for workbook visuals
Close-up of the KQL enrichment query that joins SecurityEvent data with the GeoIP watchlist.
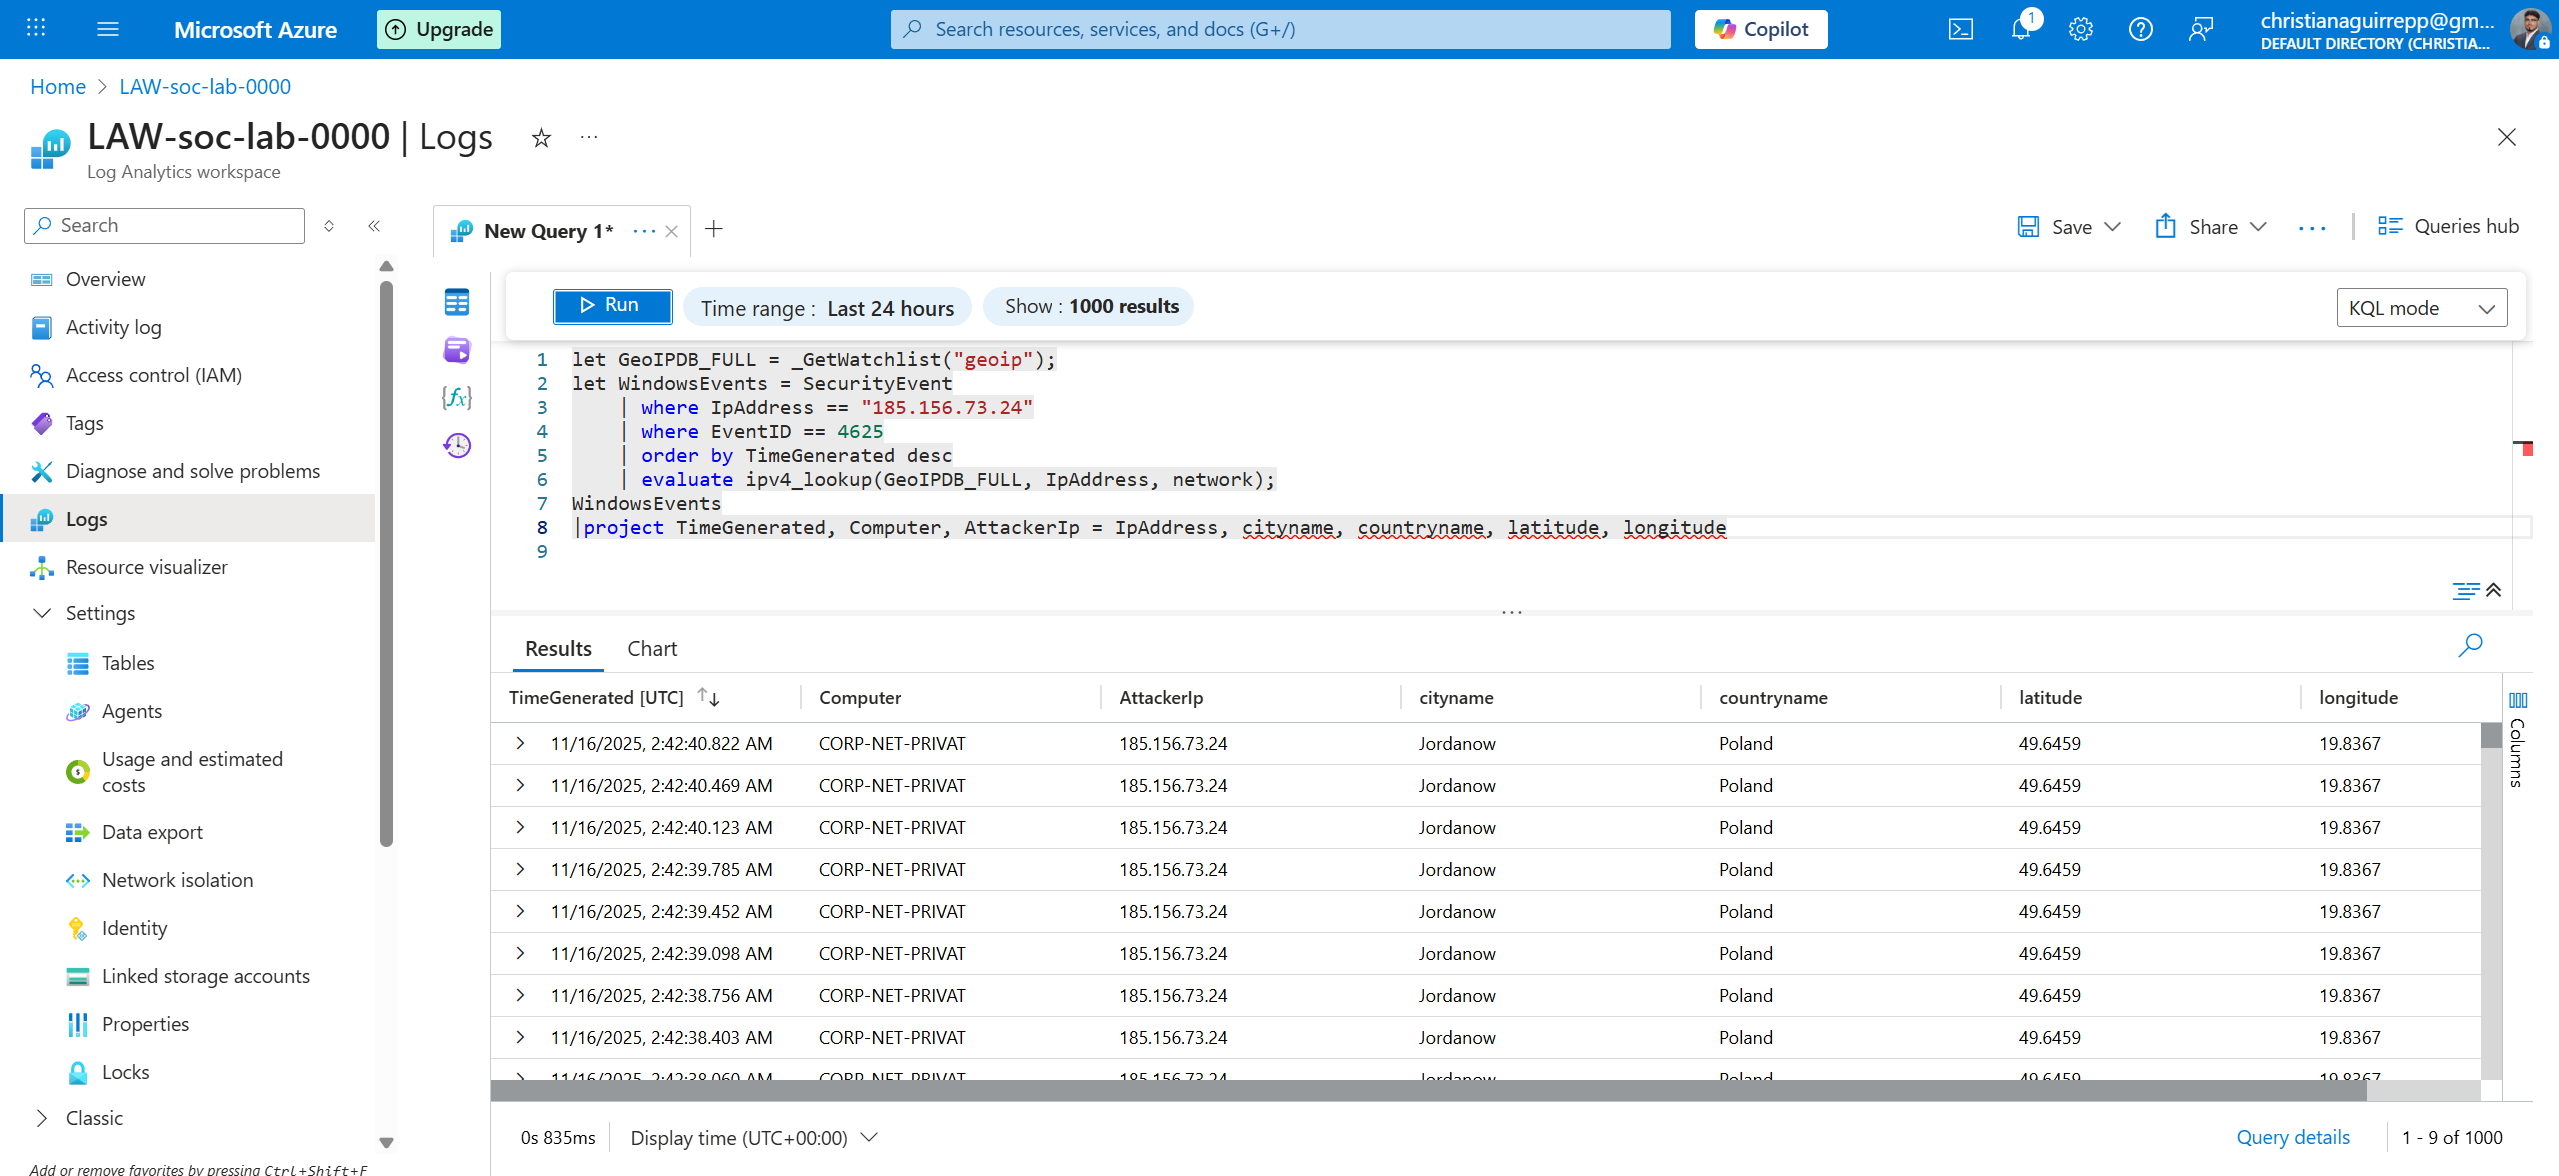
Final enriched attacker table including source IP, country, region, and coordinates.
Phase 4 — Building the world map workbook in Microsoft Sentinel
With enriched attacker telemetry available, the next step was to design a Sentinel workbook that could
surface patterns visually. Azure Maps-based visuals were configured to plot failed-logon events on a
global map, allowing quick identification of hotspots and campaign origins.
4.1 — Creating a Sentinel workbook for attack visualization
A new Sentinel workbook was created and bound to the enriched KQL query. Map visuals were added
to display attacker locations, while additional charts summarized event volumes and trends over
time for SOC-style triage.
- Started from a blank Sentinel workbook and added a KQL data source
- Mapped latitude and longitude fields from the enrichment output
- Added filters for timeframe, username, and attack country
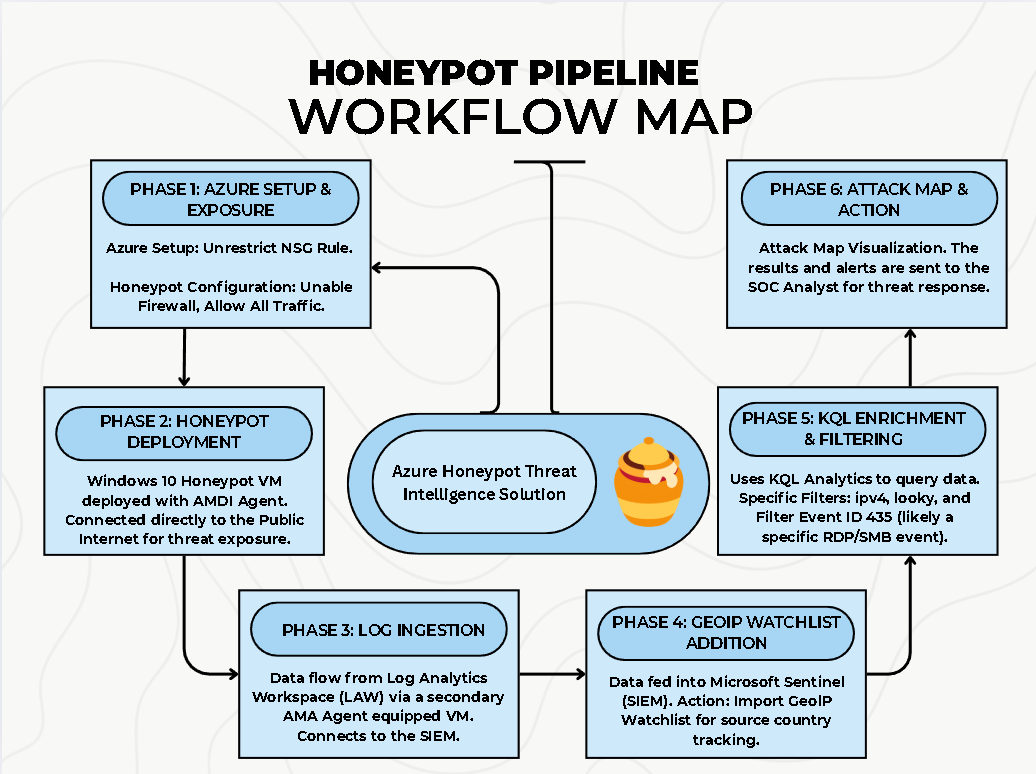
Workflow diagram summarizing exposure, log ingestion, enrichment, and visualization stages.
4.2 — Interpreting the interactive attack map
The final workbook visualized enriched 4625 events on an Azure Maps canvas. Each point represented
at least one failed RDP logon from a specific geographic region, with color and size reflecting
event volume. Analysts could pivot by time range, username, or source country.
- Mapped thousands of events into a single, intuitive global view
- Highlighted regions generating the most persistent brute-force traffic
- Provided non-technical viewers with a clear story of "who is attacking from where"
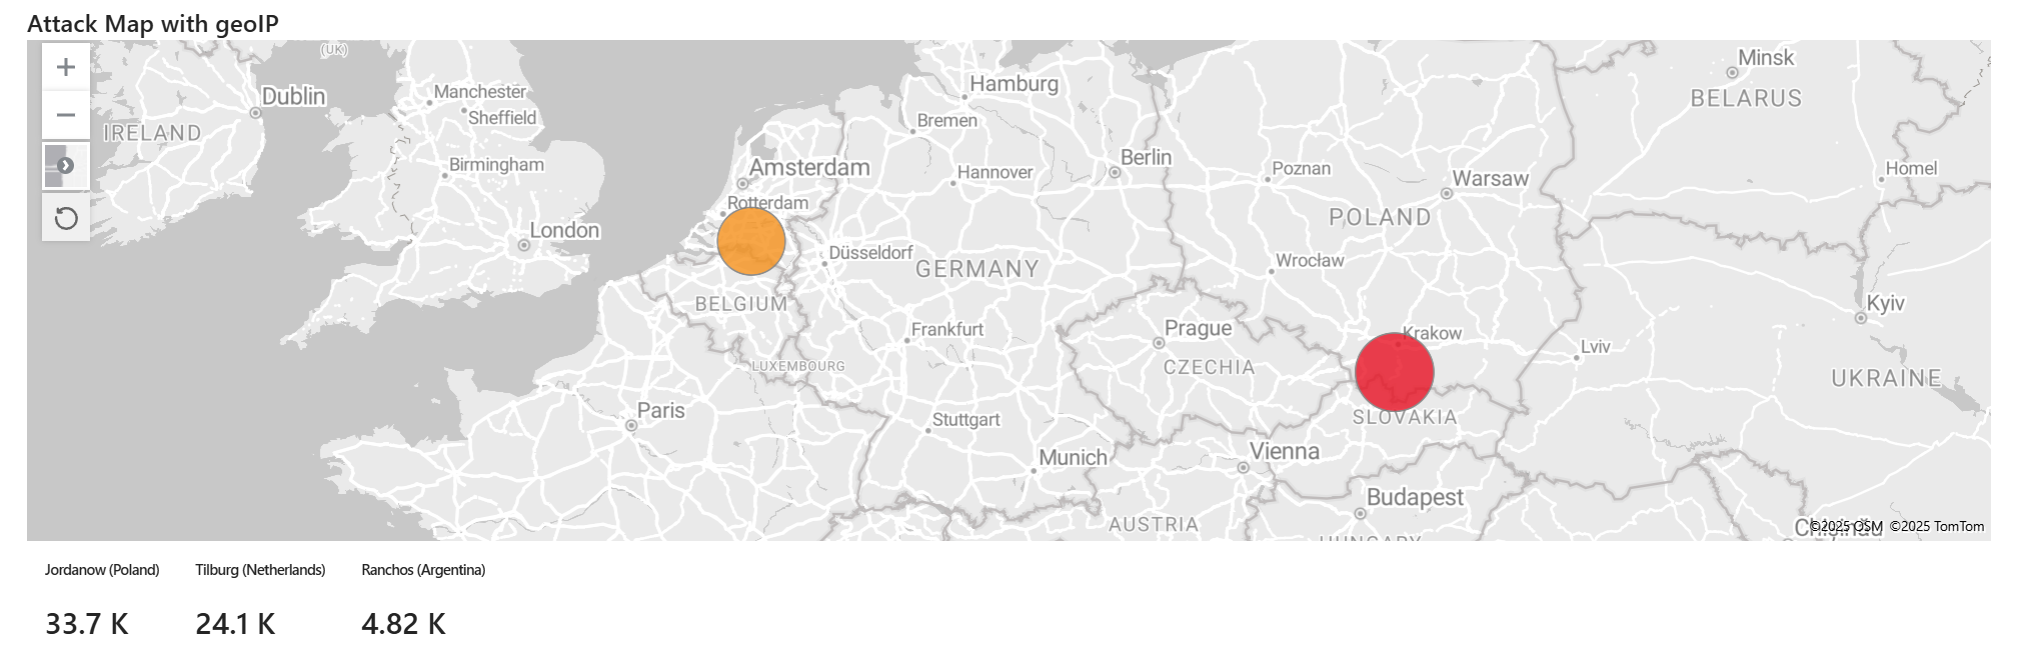
Sentinel workbook map showing global failed-logon activity from the enriched honeypot telemetry.
Phase 5 — SOC-style investigation and insights
With the map and enriched logs in place, the final phase focused on using Sentinel like a SOC analyst:
pivoting through events, correlating activity into incidents, and extracting lessons about exposure,
attacker behavior, and effective detection strategies.
5.1 — Identifying brute-force campaigns and attacker clusters
By grouping failed-logon events by IP, country, and time window, it became clear that many of
the attempts originated from a relatively small set of automated infrastructure. These clusters
behaved as long-running brute-force campaigns rather than one-off human attackers.
- Aggregated thousands of events into a smaller set of campaigns and IP clusters
- Observed persistent attackers reattempting access over several days
- Linked behaviors back to common automated scanning infrastructure
Enriched attacker table used to pivot between IP clusters, usernames, and GeoIP attributes.
5.2 — Lessons learned for hardening and monitoring
The lab underscored how quickly an exposed RDP service can attract attention and how critical it
is to layer both prevention and detection. Even in a controlled environment, attacks began within
minutes of exposure, and continued at a steady rate for days.
- Exposed RDP should be treated as a high-risk configuration by default
- GeoIP enrichment dramatically improves triage speed and reporting quality
- Sentinel workbooks provide a powerful way to tell the story of inbound threat activity
The completed workbook used for SOC-style investigation and executive-ready visual summaries.