Phase 1 — Understanding the dataset and Bellabeat's question
The analysis uses a public Fitbit dataset with about 30 users observed over 30 days. It includes
daily steps, distances, calories, intensity minutes, and separate tables for sleep and weight.
The guiding question is how these patterns can help Bellabeat increase activation, retention,
and daily engagement with its own smart devices.
1.1 — Business framing
Bellabeat wants to know when its users are most active, how consistently they sleep, and how
these behaviors line up with device usage. By treating Fitbit users as a proxy for Bellabeat's
target audience, this analysis prototypes the kinds of metrics and visuals that would power
Bellabeat's wellness app and marketing campaigns.
- Translate raw movement and sleep metrics into engagement signals
- Focus on a 30-day window that mirrors an onboarding period
- Compare weekday versus weekend behavior to time nudges and campaigns
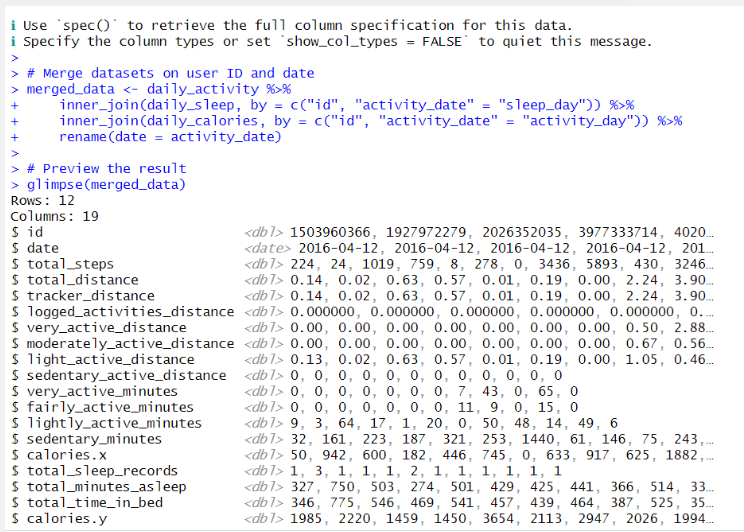
Merged Fitbit dataset preview with daily activity metrics for each user.
1.2 — Core variables analyzed
To keep the project focused, a subset of fields was selected that best capture daily wellness:
steps, total distance, calories burned, active minutes at different intensities, and sleep
duration. These map to KPIs Bellabeat could track in its own product.
- Daily activity metrics: steps, distance, calories, intensity minutes
- Sleep metrics where available: total minutes asleep and time in bed
- User identifiers to track behavior across the 30-day period
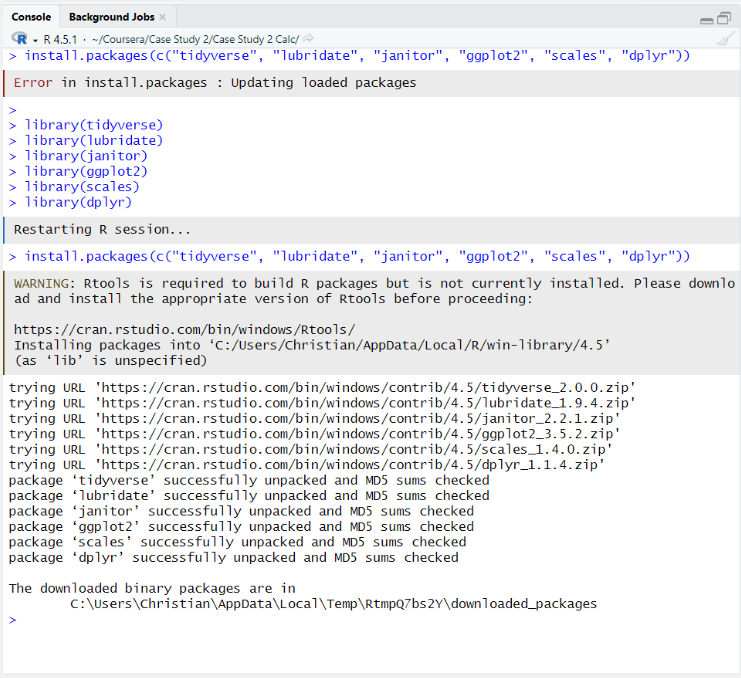
R environment prepared with tidyverse, lubridate, janitor, and ggplot2 for the analysis.
Phase 2 — Data cleaning and feature engineering
Activity and sleep tables did not share a perfect key out of the box. Date formats were standardized,
duplicate entries removed, and tables joined at the user and date level. From there, features were
engineered that describe a typical day for each user.
2.1 — Cleaning the merged dataset
The merged activity data needed basic hygiene before it could be trusted. Records with missing
or zero steps were filtered out, date fields converted to proper date types, and column names
aligned across tables.
- Removed rows with missing values or zero total steps
- Standardized date formats for reliable joins and grouping
- Applied consistent, snake_case column names using janitor::clean_names()
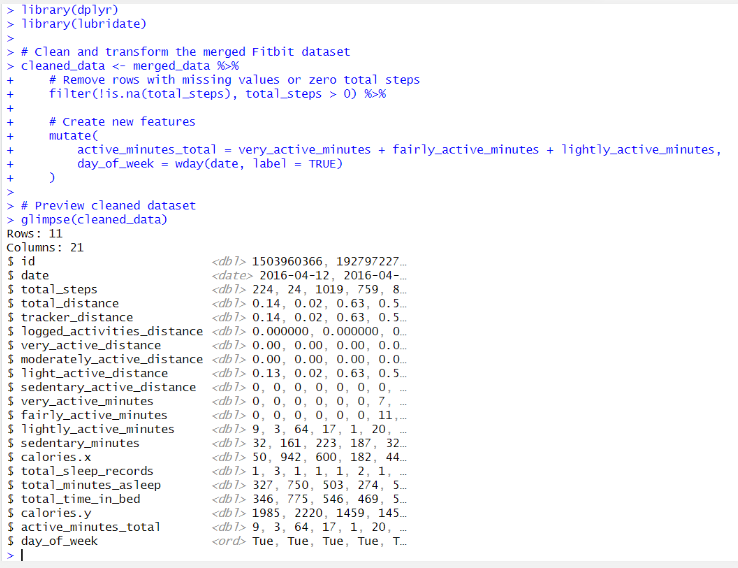
Cleaned dataset with engineered metrics such as total active minutes and weekday labels.
2.2 — Creating daily wellness features
After joining activity and sleep tables on user + date, features were engineered that Bellabeat
could track as KPIs: total active minutes, sleep minutes, and day of week. These become the
foundation for segmenting users and spotting opportunities.
- Combined very, fairly, and lightly active minutes into active_minutes_total
- Derived day_of_week to compare weekdays and weekends
- Kept sleep metrics aligned with the same daily grain as activity
Sample R — merge and engineer features
library(tidyverse)

library(lubridate)

library(janitor)


daily_activity <- read_csv("dailyActivity_merged.csv") %>%

  clean_names()


merged <- daily_activity %>%

  inner_join(daily_sleep, by = c("id", "activity_date")) %>%

  mutate(

    day_of_week = wday(activity_date, label = TRUE),

    active_minutes_total = very_active_minutes +

                           fairly_active_minutes +

                           lightly_active_minutes

  )
Phase 3 — Daily and weekly behavior patterns
With a clean daily view of each user, examination focused on how steps, active minutes, calories,
and sleep changed by day of week. This highlights when users are most engaged with their wellness
routine and where there may be drop-off.
3.1 — Movement patterns by weekday
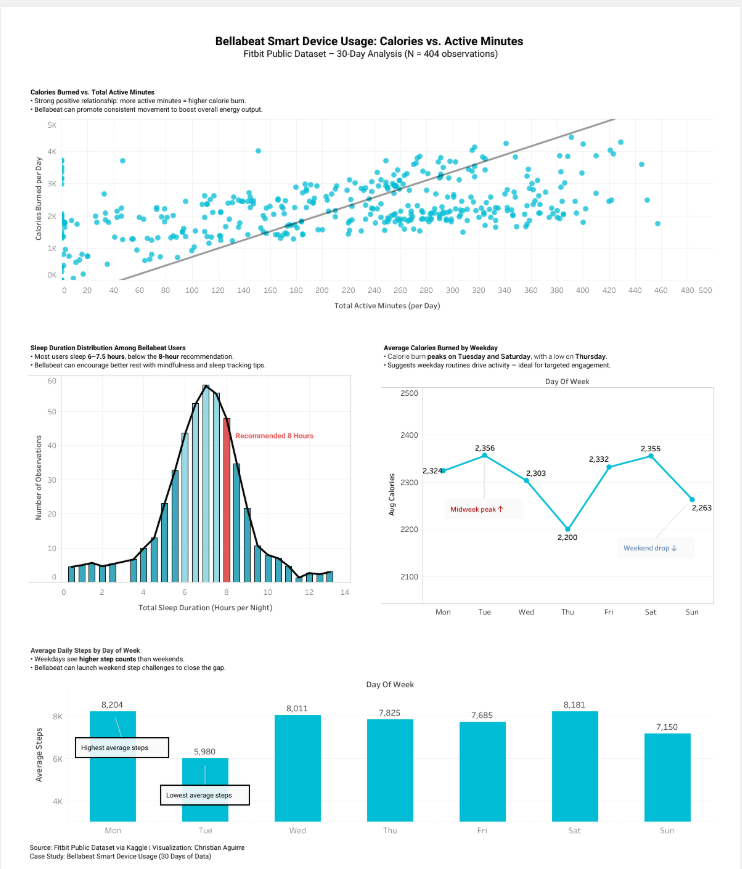
Average steps and calories peak midweek and dip on weekends. This suggests that structured
routines (work, commute, gym) drive more consistent movement than unstructured weekend time.
- Average steps exceed 8,000 on several weekdays
- Tuesday and Saturday show strong calorie peaks, with a dip around Thursday
- These midweek highs are natural anchors for step challenges and streaks
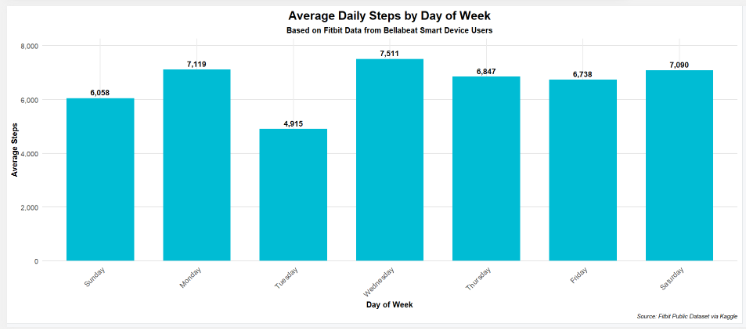
Average daily steps by weekday — weekdays outpace weekends, especially midweek.
3.2 — Calories vs active minutes
A scatter plot of total active minutes versus calories burned shows a clear positive
relationship: more movement reliably translates into higher energy expenditure.
- Users with 250+ active minutes per day burn substantially more calories
- The trend line provides a simple way to explain "move more, burn more" to users
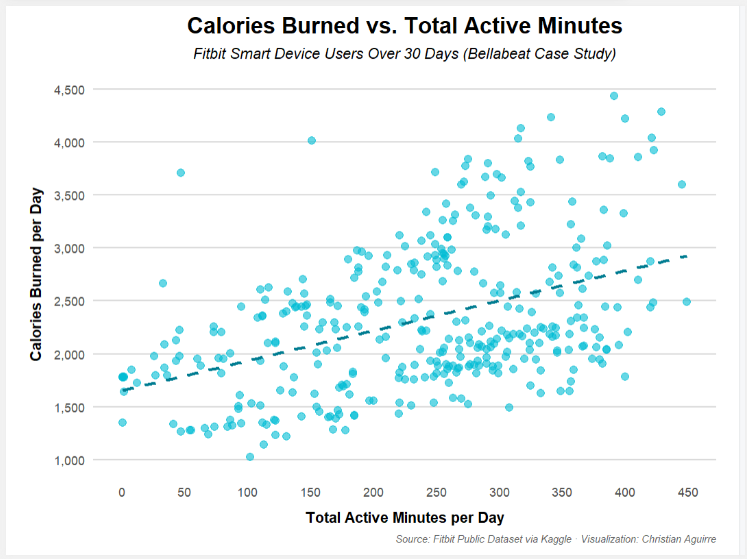
Strong positive relationship between total active minutes and calories burned.
3.3 — Sleep duration distribution
Most users sleep between six and seven and a half hours per night, which is below the
recommended eight hours. This creates an opportunity for Bellabeat to position sleep
insights as a core value add.
- Sleep duration clusters tightly in the 6–7.5 hour window
- Short sleepers stand out as a high-impact audience for coaching content
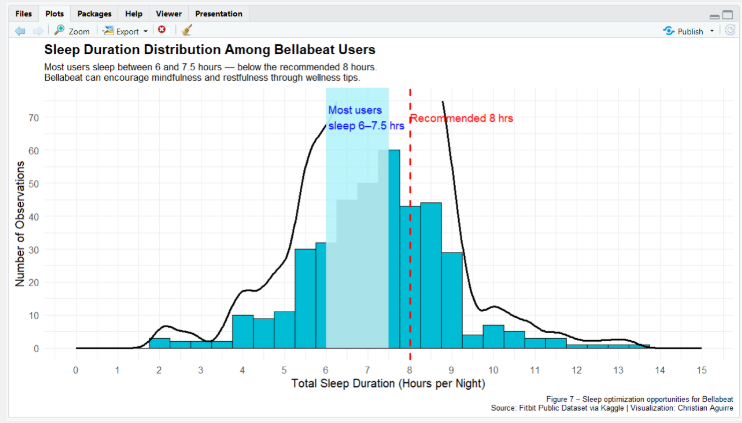
Histogram of sleep duration with the recommended 8 hours highlighted as a target.
Phase 4 — Visualizing the story and summarizing metrics with R
Once the core metrics were engineered, R and ggplot2 were used to create visuals and summary tables
that make the data easy to read for stakeholders — even if they don't work with R themselves.
4.1 — Average calories burned by weekday
A line chart of average calories by weekday reveals midweek peaks and weekend drop-offs.
This directly supports the idea of targeting programs when users are already in motion.
- Midweek calorie peak provides a natural anchor for "power days"
- Weekend dip suggests gentler nudges rather than aggressive goals
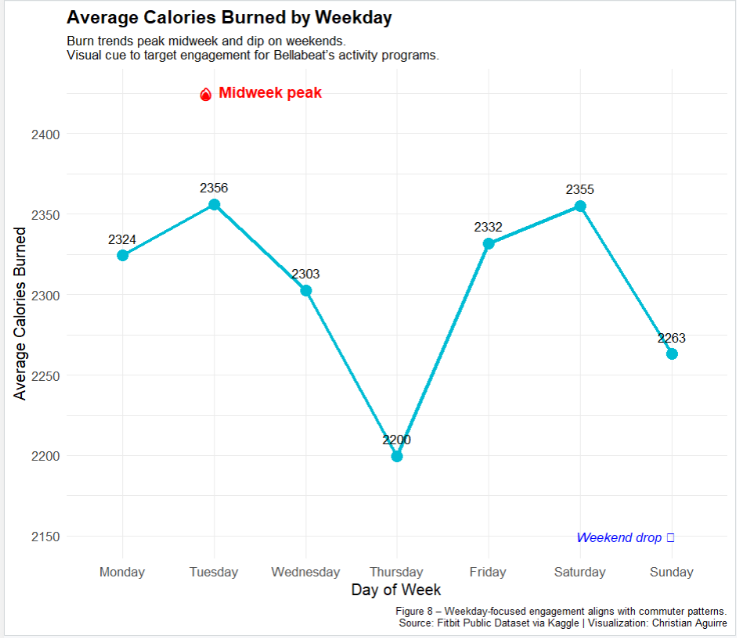
Average calories burned by weekday — midweek peak and weekend drop are clear visual cues.
4.2 — Summary table by day of week
A simple summary table helps translate visuals into numeric benchmarks that Bellabeat could
use in dashboards or user segmentation logic.
For each day of the week, average steps, calories, and sleep duration were calculated. This
makes it easy to compare performance at a glance and choose reasonable goal ranges.
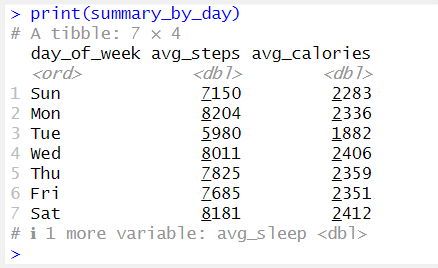
Summary of average steps, calories, and sleep minutes by weekday.
Sample R — summarizing key metrics by day of week
This R code groups the merged dataset by weekday and computes average steps, calories, active
minutes, and sleep minutes — the core KPIs that power the visuals above.
day_summary <- merged %>%

  group_by(day_of_week) %>%

  summarise(

    avg_steps = mean(total_steps, na.rm = TRUE),

    avg_calories = mean(calories, na.rm = TRUE),

    avg_active_minutes = mean(active_minutes_total),

    avg_sleep_minutes = mean(total_minutes_asleep),

    .groups = "drop"

  ) %>%

  arrange(day_of_week)
Phase 5 — Engagement opportunities and Bellabeat architecture
Once patterns were clear, they were translated into concrete actions Bellabeat could take. The
focus is on using data to time nudges, adjust messaging, and design challenges that align with
how users already live their lives.
5.1 — Engagement and marketing opportunities
- Use weekday streaks and step goals to reinforce existing activity habits
- Introduce gentle weekend reminders aimed at maintaining momentum
- Highlight sleep insights in the app for users consistently below recommended rest levels
- Promote long-term wellness programs that track both movement and sleep quality together
The calories-by-weekday view directly supports timing campaigns around midweek activity peaks.
5.2 — Architecture overview
Components
- Fitbit source tables — daily activity, sleep, and calories
- R processing layer — tidyverse pipeline for cleaning and joins
- Feature store — engineered daily metrics and weekday labels
- Visualization layer — R charts and optional Tableau dashboards
- Insight & strategy layer — marketing and product recommendations
Data flow
- Raw Fitbit CSVs → R import and cleaning
- Cleaned activity and sleep data → joined daily view
- Daily view → aggregated by user and day of week
- Aggregations → charts and dashboard views
- Visuals and tables → Bellabeat engagement strategy and campaigns
Composite dashboard bringing together activity, sleep, and calorie insights for Bellabeat stakeholders.