← Back to Portfolio
Database Revitalization SQL Server Normalization ERD Modeling Business Intelligence

Landscape Database Revitalization

Rebuilt a fragmented landscaping company data environment into a clean, normalized SQL Server system. Standardized entities, enforced relational integrity, and built a full query library to uncover client trends, service patterns, and project profitability.

12
Entities
Modeled across the core ERD
30+
SQL queries
Reusable business insight library
3NF
Normalization
Schema standardized to third normal form
100%
Integrity
All relationships enforced by constraints
0
Redundancy
Duplicate fields eliminated through design
Advanced Database Management SQL Server, SSMS, ERDPlus Spring 2023

Project overview

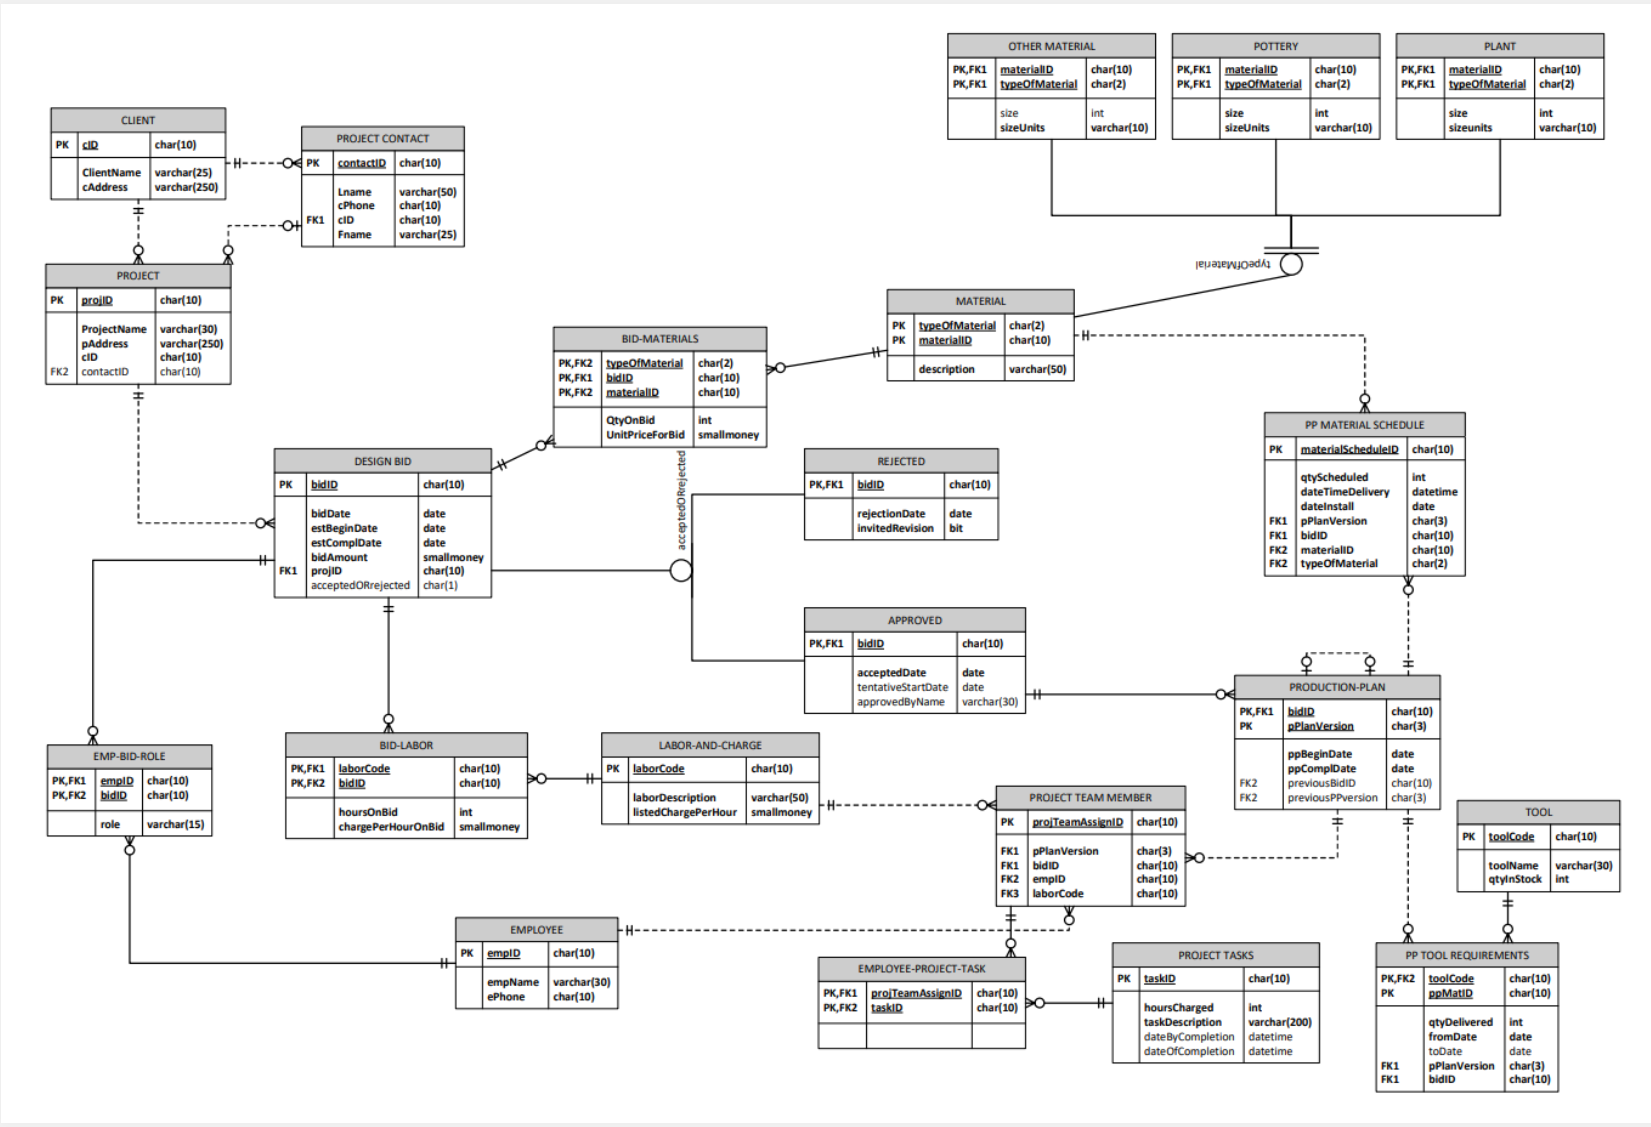
The original data environment mixed spreadsheets, ad hoc tables, and partially designed schemas. Client records appeared in several places, bid amounts did not tie cleanly to labor and material costs, and basic questions about profitability required manual reconciliation.

Key deliverables

  • Normalized SQL Server schema with primary and foreign keys plus business constraints
  • ERD modeling for clients, projects, bids, labor, materials, tools, and production planning
  • Standardized legacy operational data into clean relational tables
  • More than thirty analytical SQL queries for revenue, demand, and margin analysis
  • Deployment and usage documentation for technical and non-technical stakeholders

Workflow Overview

Phase 1

Requirements & audit

Reviewed legacy spreadsheets and tables, identified duplicated data, and documented core business questions.

Phase 2

Conceptual modeling

Designed an ERD capturing clients, projects, bids, labor, materials, and suppliers with correct cardinalities.

Phase 3

Schema build

Implemented the logical model in SQL Server with tables, keys, indexes, and constraints.

Phase 4

Data load & validation

Migrated sample data, reconciled totals across modules, and verified referential integrity.

Phase 5

Analytics & reporting

Developed a library of insight queries and outlined how they feed BI dashboards.

Database Breakdown

Phase 1 — Data standardization and module design

The first step was to convert scattered operational data into a single consistent model. This included cleaning naming conventions, aligning data types, and deciding which entities belonged in which tables.

1. Data standardization module

Consistency and normalization

Consolidated legacy client, project, and service data into a canonical model. Applied clear naming standards and enforced data types so every field has one meaning and one home.

2. Redundancy elimination module

Keys and constraints

Replaced duplicated records and repeated columns with relational joins. Implemented primary keys, foreign keys, and unique constraints to maintain integrity and improve performance.

3. Business insights module

SQL analytics

Designed a set of tables and relationships specifically to support revenue, cost, and workload analysis so the database doubles as a reporting asset.

Phase 2 — ER modeling and database design

Using ERDPlus, the full lifecycle of a landscaping project was modeled, from first contact and bid through labor, materials, and production planning. The ERD became the contract between business rules and technical implementation.

  • Entities: Client, Project, DesignBid, Material, Labor, Tools, ProductionPlan, ProjectTasks, Suppliers, and supporting bridge tables
  • Attributes: bid amounts, labor rates, material units and costs, task hours, approval dates, and schedule details
  • Relationships: client to project (one to many), project to bid (one to many), project to labor and materials (many to many via bridges), and production planning tied to the approved bid
  • Cardinalities were refined to match real workflows, such as multiple bid iterations per project with only one final approved version
Normalized ERD diagram

Normalized ERD for the landscape services database, showing clients, bids, labor, materials, tools, suppliers, and production planning.

Phase 3 — SQL schema implementation

The conceptual model was implemented in SQL Server Management Studio as a scripted deployment. This ensures the database can be rebuilt from source control at any time.

The script initializes the database, builds core tables, and wires up keys and constraints. From there, sample or production data can be loaded for analytics and reporting.

-- Create database
IF DB_ID('NBDDB_CTF') IS NOT NULL
    DROP DATABASE NBDDB_CTF;
GO

CREATE DATABASE NBDDB_CTF;
GO

USE NBDDB_CTF;
GO

-- Client table
CREATE TABLE Client (
    ClientID   INT IDENTITY(1,1) PRIMARY KEY,
    ClientName VARCHAR(100) NOT NULL,
    Phone      VARCHAR(20),
    Email      VARCHAR(100),
    City       VARCHAR(50),
    StateCode  CHAR(2)
);

-- Project table
CREATE TABLE Project (
    ProjectID   INT IDENTITY(1,1) PRIMARY KEY,
    ClientID    INT NOT NULL,
    ProjectName VARCHAR(120) NOT NULL,
    StartDate   DATE,
    EndDate     DATE,
    Status      VARCHAR(30),
    CONSTRAINT FK_Project_Client
        FOREIGN KEY (ClientID) REFERENCES Client(ClientID)
);

Schema scripts enforce referential integrity and provide a clean baseline for loading data.

Phase 4 — Analytical insight queries

On top of the normalized schema, more than thirty queries were developed that support estimators, managers, and operations. These can be used in SSMS or wired into BI dashboards.

  • Identify which services drive the most revenue and how demand shifts by season
  • Track high-value clients based on repeat work, total revenue, and profit contribution
  • Compare estimated versus realized margins by combining bids with labor and material costs
  • Highlight suppliers or materials where cost changes are eroding profitability
-- Popular services by volume
SELECT      s.ServiceName,
            COUNT(*) AS ProjectCount
FROM        Project p
JOIN        ProjectService ps ON p.ProjectID = ps.ProjectID
JOIN        Service s         ON ps.ServiceID = s.ServiceID
GROUP BY    s.ServiceName
ORDER BY    ProjectCount DESC;

-- Client profitability summary
SELECT      c.ClientName,
            p.ProjectName,
            SUM(jm.Quantity * m.UnitCost)     AS MaterialCost,
            SUM(l.HoursWorked * l.HourlyRate) AS LaborCost,
            p.BidAmount - (
                SUM(jm.Quantity * m.UnitCost) +
                SUM(l.HoursWorked * l.HourlyRate)
            ) AS EstimatedProfit
FROM        Project p
JOIN        Client c           ON p.ClientID = c.ClientID
JOIN        JobMaterials jm    ON p.ProjectID = jm.ProjectID
JOIN        Material m         ON jm.MaterialID = m.MaterialID
JOIN        LaborAssignment l  ON p.ProjectID = l.ProjectID
GROUP BY    c.ClientName, p.ProjectName, p.BidAmount
ORDER BY    EstimatedProfit DESC;

These patterns can power dashboards that guide pricing, staffing, and which services to promote.

Phase 5 — Testing, quality checks, and roadmap

The final phase focused on validating the new schema, proving that constraints behave correctly, and outlining how the system can grow into a full production analytics platform.

Testing and debugging approach

  • Parameter variation: validated queries across multiple time windows, regions, and service filters to confirm they behaved correctly under different scenarios
  • Data consistency checks: reconciled totals between bids, labor, and materials to ensure every dollar traces back to a project and client
  • Constraint testing: exercised inserts, updates, and deletes to confirm that foreign keys and unique constraints blocked invalid states
  • Reviewed execution plans and introduced indexes where needed to keep analytics responsive

Future enhancements

  • Real-time integration: connect the schema to operational systems via ETL or change data capture
  • Automated reporting: schedule weekly margin and workload snapshots for owners and project managers
  • Expanded metrics: incorporate satisfaction scores, rework rates, and seasonal patterns for deeper insight
  • Extend style conventions and contribution guidelines for multi-developer collaboration

Implementation Impact

Database revitalization transformed fragmented operational data into a strategic asset supporting data-driven decision making across the organization.

Database Design Principles

4 KEY OUTCOMES
REDUNDANCY ELIMINATION

A normalized schema dramatically reduces redundancy and confusion in operational reporting.

GRANULAR COSTING

Modeling costs at the material and labor level unlocks accurate project profitability analysis.

WORKFLOW ALIGNMENT

Entity relationships that mirror real workflows make it easier to extend the database later.

VERSION CONTROL

Scripted deployments turn the database into an asset that can be versioned and reused.

Business Intelligence Strategy

Tier 1: Operational Reporting

Objective: Enable daily operational insights for project managers and estimators.

  • Service demand tracking Identify which services drive revenue and how demand shifts seasonally.
  • Real-time project status Monitor active projects, resource allocation, and delivery timelines.
  • Material cost monitoring Track supplier pricing changes and material cost trends.

Tier 2: Client Analytics

Objective: Understand client value and optimize relationship management.

  • High-value client identification Track clients based on repeat work, total revenue, and profit contribution.
  • Regional analysis Compare performance across geographic markets and service areas.
  • Retention metrics Monitor client retention rates and identify at-risk relationships.

Tier 3: Strategic Planning

Objective: Support long-term strategic decisions with profitability insights.

  • Margin analysis Compare estimated versus realized margins across project types.
  • Capacity planning Forecast labor and equipment needs based on pipeline projections.
  • Service optimization Identify which service lines to expand, maintain, or phase out.

Key insights

  • Normalized design eliminates data redundancy and ensures single source of truth.
  • Granular cost modeling enables accurate project profitability and margin analysis.
  • Entity relationships aligned with business workflows support natural system extension.
  • Scripted deployment approach enables version control and reproducible builds.
  • Comprehensive query library accelerates insight generation and decision support.

Skills demonstrated

SQL Server Normalization (1NF–3NF) ER Modeling Data Integrity Query Optimization Business Intelligence

Summary

This project transformed a fragmented landscaping database into a clean, normalized SQL Server implementation. Grounded in a comprehensive ERD and backed by constraints and analytics, the system now produces trustworthy insight into customers, services, and profitability. The revitalized schema gives the business a scalable foundation for future dashboards, automation, and decision support tools.