← Back to Portfolio
Operations Management Optimization Models Simulation Decision Analysis Excel Solver

Quantitative Decision Modeling

A six-part operations and supply chain portfolio that applies queueing theory, linear programming, mixed and binary integer programming, Monte Carlo simulation, and decision tree analysis to real business scenarios. Each model moves from structured data to clear recommendations supporting cost control, service quality, and risk-aware decision making.

6
Models
Optimization, simulation, and decision problems
3
Categories
Optimization, simulation, and decision models
20
Trials
Monte Carlo simulation iterations
95%
Confidence
Statistical confidence level
100
Min total time
Optimal machinist assignment result
Operations and Supply Chain Management Excel Solver, LINGO Fall 2023

Project overview

This portfolio sits at the intersection of operations research and managerial decision making. Over the semester worked through six structured business problems that mirror real situations in retail checkout lines, grocery inventory planning, new product launches, legal strategy, and manufacturing shop floors.

Key deliverables

  • Queueing-based staffing recommendation for retail checkout system
  • Inventory decision framework using payoff and regret tables
  • Monte Carlo simulation quantifying profit variability and risk
  • Linear programming cost comparison for copier alternatives
  • Decision tree and EMV analysis for patent lawsuit strategy
  • Binary integer assignment model for machinist-machine pairing

Workflow Overview

Phase 1

Problem framing

Interpreted narrative case descriptions and clarified objectives, decision levers, and constraints.

Phase 2

Model selection

Chose appropriate structures including queueing, LP, BILP, Monte Carlo, and decision trees.

Phase 3

Implementation

Implemented models in Excel and LINGO with clean input, calculation, and output blocks.

Phase 4

Scenario testing

Ran what-if analysis and sensitivity checks on key parameters and assumptions.

Phase 5

Managerial insight

Translated model outputs into staffing, stocking, investment, and legal recommendations.

The six problems fall into three major categories of management science: optimization models, simulation models, and decision models. Together they create a compact but powerful toolkit for reasoning about capacity, uncertainty, and tradeoffs.

  • Optimization models: queueing-based staffing, linear programming cost comparison, and binary integer assignment
  • Simulation models: Monte Carlo sampling to quantify distribution and downside risk of new product profit
  • Decision models: payoff and regret tables for perishable inventory and decision trees for legal strategy
  • Tools: Excel with Solver for LP, mixed integer and nonlinear models, and LINGO for compact model specification

Model Breakdown

Optimization — staffing, cost minimization, and assignment

These models use queueing theory, linear programming, and binary integer programming to recommend staffing levels, equipment choices, and assignments that minimize cost or time while respecting real-world constraints.

Problem A — Customer checkout optimization with queueing theory

Using an M/M/c queue to balance staffing cost and customer waiting time

A retail manager worried that long checkout lines were causing customers to abandon purchases. The question: how many cashiers should be staffed so that a typical customer does not wait more than a few minutes, without overspending on labor.

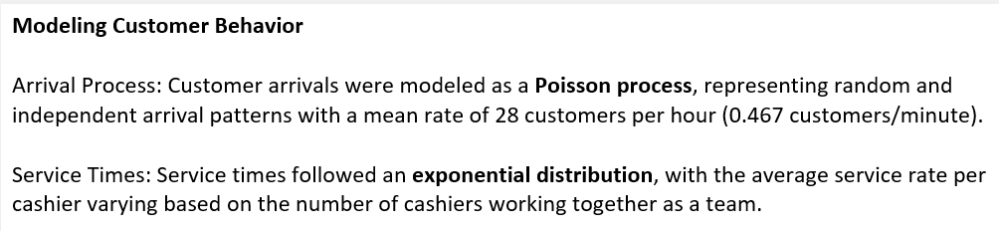
  • Modeled customer arrivals as a Poisson process and service times as exponentially distributed
  • Used an M/M/c queueing framework to estimate utilization, probability of waiting, and expected wait time
  • Evaluated scenarios with one, two, and three cashiers and compared performance measures
  • Interpreted results in terms of customer experience and labor cost for the store manager
ρ  = λ / (c · μ)           -- server utilization
Lq ≈ function(λ, μ, c)      -- expected number in queue
Wq = Lq / λ                  -- expected waiting time in queue
W  = Wq + 1 / μ              -- total time in system

Choose the smallest c such that Wq stays below
the target waiting time (for example 5 minutes).

The model showed that one cashier leads to very high utilization and long queues. Two cashiers reduce the problem but still miss the target during busy periods. With three cashiers, expected waiting time stays under the five-minute goal and the probability of a visible line collapses, justifying the additional staffing cost.

Queueing system parameters

Modeling arrival rates, service rates, and queueing parameters that drive checkout system performance.

Problem D — Linear programming cost comparison for copier selection

Modeling daily operating cost of copier options in a law office

A law office needed to choose between a regular copier and a high-speed copier. Each option had different lease payments, speeds, and operating costs, and the firm wanted a structured comparison instead of intuition about which machine "felt" faster.

  • Calculated effective hourly cost by combining lease and operating cost components
  • Estimated hours required to process the daily print volume under each copier
  • Formulated total daily cost as a simple linear function of pages and copy rate
  • Used Solver to confirm that the lower total daily cost defines the optimal choice
Let:
    V        = required pages per day
    rate_A   = pages per hour for Copier A
    rate_B   = pages per hour for Copier B
    cost_hrA = hourly cost for A
    cost_hrB = hourly cost for B

Then:
    hours_A     = V / rate_A
    hours_B     = V / rate_B
    TotalCost_A = hours_A · cost_hrA
    TotalCost_B = hours_B · cost_hrB

Choose the copier with the lower TotalCost.

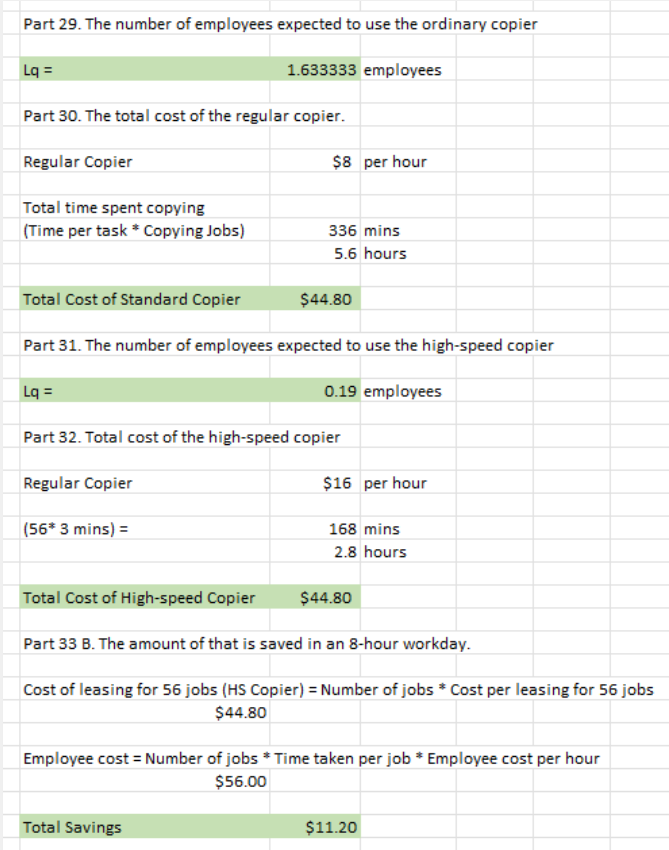
The high-speed copier completed the workload in fewer hours and generated an estimated daily savings of around eleven dollars versus the regular copier. Over a multi-year lease this compounds into a meaningful reduction in operating cost and staff time.

Copier cost comparison

Cost comparison showing the high-speed copier delivers lower combined operating and labor cost.

Problem F — Binary integer assignment for machinist-machine pairing

Assigning machinists to machines to minimize total processing time

A small manufacturing operation had four machinists and four machines. Each machinist had different processing times on each machine, and one machinist lacked certification on a specific machine. The goal: choose assignments that minimize total time.

  • Defined binary decision variables indicating whether machinist i is assigned to machine j
  • Minimized total processing time as a sum of processing time times assignment variables
  • Required each machinist to be assigned to exactly one machine and vice versa
  • Encoded certification restrictions as additional constraints
  • Implemented and solved the model in LINGO as a classic assignment problem
Minimize   Σᵢ Σⱼ ( time[i,j] · x[i,j] )

Subject to:
    Σⱼ x[i,j] = 1      for each machinist i
    Σᵢ x[i,j] = 1      for each machine j
    x[3,turning] = 0   machinist 3 not certified
    x[i,j] ∈ {0,1}

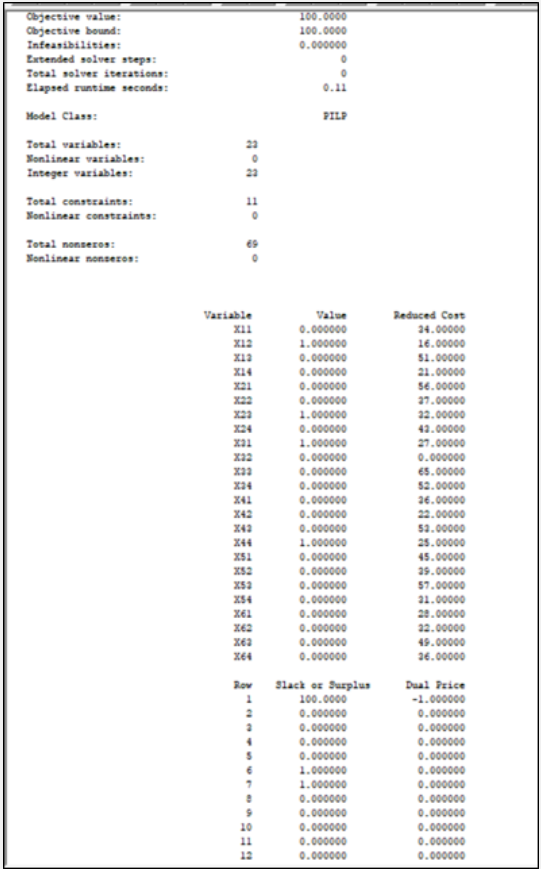
The optimal assignment sent Machinist 3 to the metal lathe, Machinist 1 to the turning machine, Machinist 2 to the milling machine, and Machinist 4 to the radial drill. The minimum total time of 100 minutes was lower than any intuitive pairing the manager had considered.

LINGO optimal assignment

LINGO solution confirming the optimal machinist-machine pairing and 100-minute total processing time.

Simulation — Monte Carlo profitability and risk analysis

The simulation component focuses on modeling uncertainty explicitly, generating a distribution of outcomes instead of a single "best guess." This is especially helpful when both upside and downside risk matter.

Problem C — New product profitability under uncertain cost structure

Monte Carlo simulation for per-unit profit and confidence intervals

A firm evaluated whether to introduce a new product with a known selling price but uncertain cost components such as purchase cost, labor, and transportation. Rather than rely on one point estimate, management needed to understand the distribution of profit per unit.

  • Specified probability distributions for purchase, labor, and transportation cost based on historical data
  • Held demand at 1,000 units and computed profit per unit in each trial
  • Ran twenty simulation trials and summarized mean, standard deviation, and confidence interval
  • Used the interval to describe a range of likely profit outcomes for planning purposes
For each trial i:
    purchase_cost[i]   ~ Dist_purchase(...)
    labor_cost[i]      ~ Dist_labor(...)
    transport_cost[i]  ~ Dist_transport(...)

    profit_per_unit[i] = SellingPrice
                         - purchase_cost[i]
                         - labor_cost[i]
                         - transport_cost[i]

After n trials:
    μ  = mean(profit_per_unit)
    σ  = sd(profit_per_unit)
    CI = μ ± 1.96 · σ / √n     -- 95% CI

The simulation produced an average profit of roughly $6.90 per unit with a standard deviation of about $2.27. The 95% confidence interval ranged from roughly $4.50 to just over $9.00. This gave leadership a clear sense of both upside and downside.

Monte Carlo simulation results

Simulation trials showing mean profit, variability, and confidence interval bounds for the new product.

Decision models — payoffs, regret, and legal strategy

The decision models translate uncertainty and payoffs into structured comparisons using payoff tables, regret tables, and decision trees. These tools help managers move from gut feeling to transparent, defensible choices.

Problem B — Specialty steak stocking with payoff and regret tables

Perishable inventory decision making under demand uncertainty

A grocery manager needed to decide how many pounds of a specialty steak to stock each week. Demand is uncertain, the product is perishable, and unsold meat must be marked down or discarded. Ordering too little leaves profit on the table, while ordering too much wastes product and margin.

  • Defined candidate order quantities and demand levels with associated probabilities
  • Built a payoff table computing weekly profit for each quantity and demand level
  • Derived a regret table capturing opportunity loss versus the best action in each state
  • Applied expected value, optimistic, pessimistic, and minimax regret criteria
  • Performed sensitivity analysis on demand probabilities to test robustness
Expected Profit(Q) = Σ over demand levels d [
                     P(D = d) · Profit(Q, d)
                 ]

Regret(Q, d) = BestProfit(d) - Profit(Q, d)

Choose:
    Q* that maximizes Expected Profit(Q)
    and performs well under minimax regret.

The analysis indicated that ordering about 35 pounds of steak per week produced the highest expected profit (around $79) and remained attractive across alternative decision criteria. This turned a gut-level stocking guess into a documented, data-supported policy.

Problem E — Patent infringement lawsuit strategy using decision trees

Expected monetary value comparison of settling versus going to trial

A firm facing a patent infringement dispute had two main options: accept a settlement or proceed to trial. Each path involved different probabilities and very different financial outcomes. Management needed a transparent way to compare the options.

  • Mapped the situation into a decision tree with a decision node (settle vs trial) and chance nodes
  • Estimated probabilities of winning, losing, or achieving partial relief at trial
  • Attached monetary consequences including legal costs and damage payments
  • Calculated expected monetary value (EMV) for both settling and going to trial
  • Interpreted numeric results alongside the firm's risk tolerance
EMV(Settle) = Payoff_settlement

EMV(Trial)  = P(win)     · Payoff_win
              + P(lose)   · Payoff_lose
              + P(partial)· Payoff_partial

Choose the option with the higher EMV,
then test it against risk appetite and strategy.

The decision tree showed that pursuing trial produced an EMV of roughly $1.8M, versus about $1.5M for accepting the settlement. From a purely financial standpoint, litigation created more expected value, assuming the firm was comfortable with increased variability.

Decision tree analysis

Decision tree payoff and probability table used to calculate EMV for settling versus trial.

Model Applications Summary

Quantitative decision modeling transforms messy business questions into clear, actionable recommendations across operations, finance, and strategy.

Core Modeling Techniques

6 APPLICATIONS
QUEUEING THEORY

Converts vague complaints about "long lines" into quantified staffing recommendations.

LINEAR PROGRAMMING

Reveals cost and time savings that are not obvious from intuition alone.

MONTE CARLO SIMULATION

Clarifies the range and likelihood of profit outcomes under uncertain costs.

DECISION TABLES

Provides structured, auditable basis for inventory and legal strategy.

INTEGER PROGRAMMING

Optimizes discrete assignments respecting skill constraints and certifications.

QUANTITATIVE APPROACH

Turns messy business questions into clear, actionable decisions.

Key insights

  • Queueing models quantify staffing needs to meet customer service targets.
  • Linear and integer programming reveal cost savings that intuition misses.
  • Monte Carlo simulation clarifies profit distribution and downside risk.
  • Decision tables and trees provide transparent basis for strategic choices.
  • Quantitative modeling turns qualitative business questions into clear recommendations.

Skills demonstrated

Queueing Theory Linear Programming Binary Integer Models Monte Carlo Simulation Decision Trees & EMV Excel Solver LINGO Modeling Operations Strategy

Summary

This quantitative decision modeling portfolio shows how classical management science techniques move beyond textbook exercises into real business decisions. By combining queueing models, inventory analysis, Monte Carlo simulation, linear and integer programming, and decision trees, the work demonstrates a practical toolkit for choosing staffing levels, setting stocking policies, evaluating new products, selecting equipment, planning legal strategy, and assigning scarce skilled labor. The consistent pattern is taking messy, qualitative questions and turning them into structured, data-driven recommendations that managers can confidently act on.