← Back to Portfolio
Endpoint Detection Lab Windows Sysmon Event Viewer PowerShell MITRE ATT&CK

Windows Sysmon Threat Detection Lab

Built and tuned a single host Windows monitoring lab around Sysmon to practice endpoint telemetry, threat hunting, and SOC style reporting. Configured a realistic workstation, deployed Sysmon with a community configuration, focused on high value event IDs, simulated attacker behavior, and documented investigations with MITRE ATT&CK mapping.

1
Windows Host
Dedicated monitoring workstation
6
Core Event IDs
Process, file, registry, DNS, network, script
4
Simulated Cases
Baseline, downloads, persistence, C2
20+
Key Artifacts
Screenshots and representative events
4
MITRE Techniques
PowerShell, Run keys, C2, discovery
Single host detection lab Sysmon plus native Windows logging SOC friendly reports and mapping

Project overview

This lab was approached as if one Windows endpoint was assigned for monitoring as a junior SOC analyst. The objective was to prepare a clean baseline, add tuned logging with Sysmon, then follow how the host changes as simulated attacker behavior is introduced.

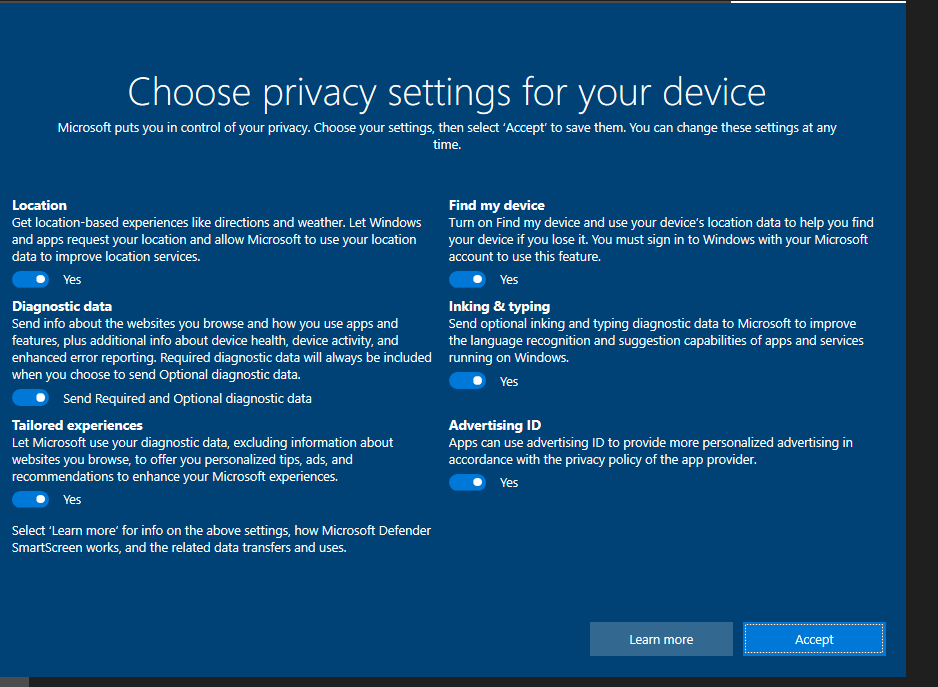
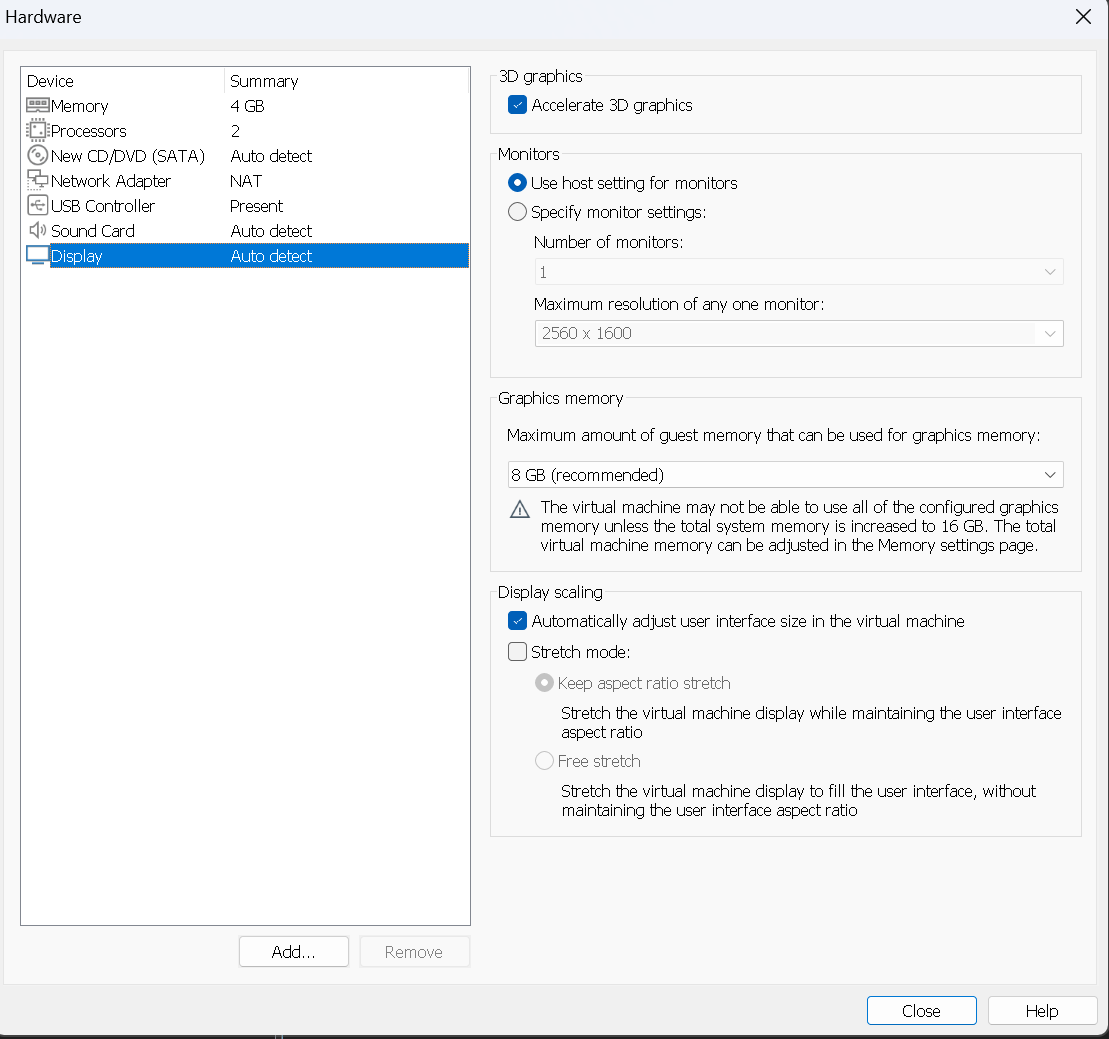
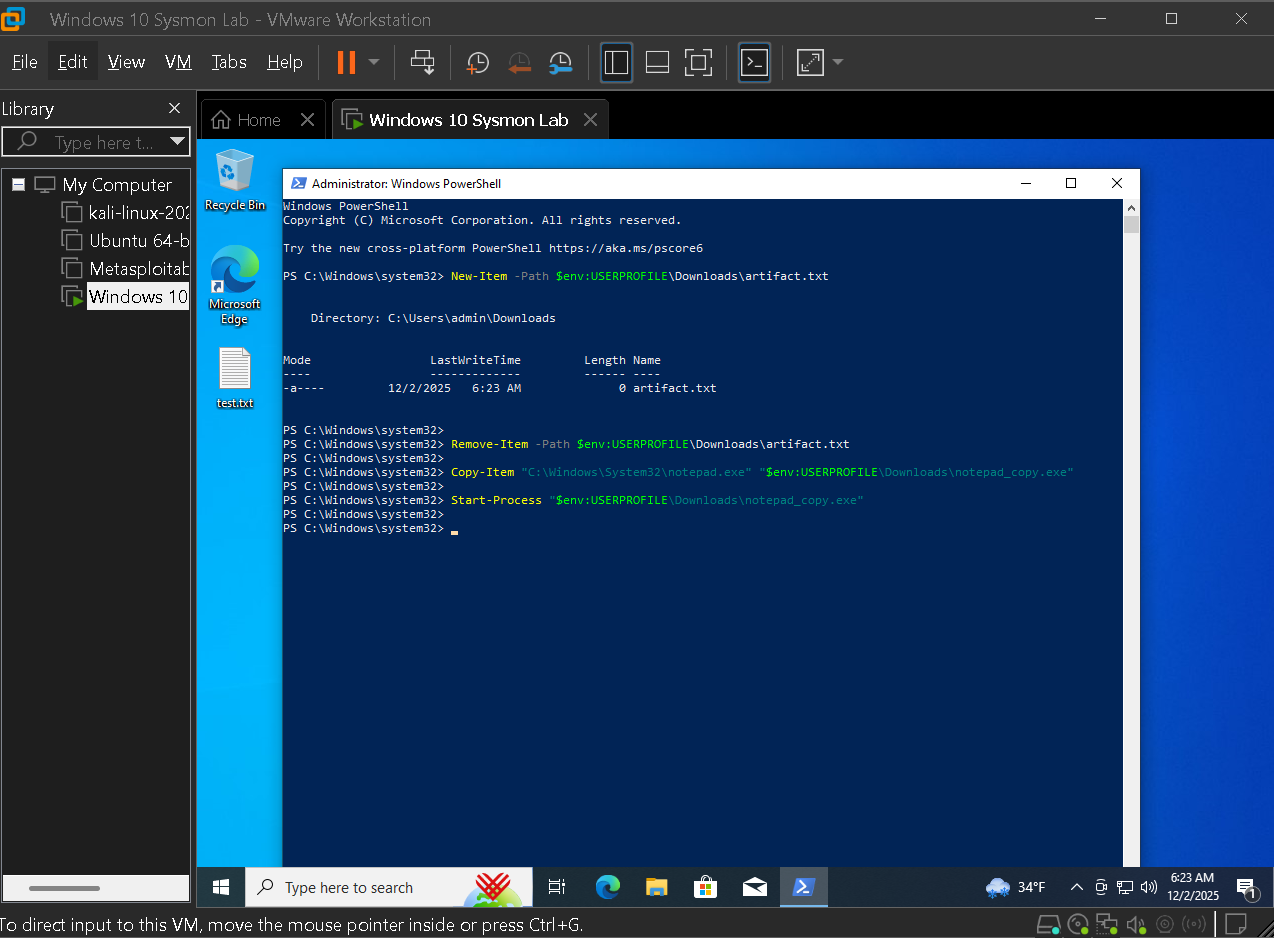
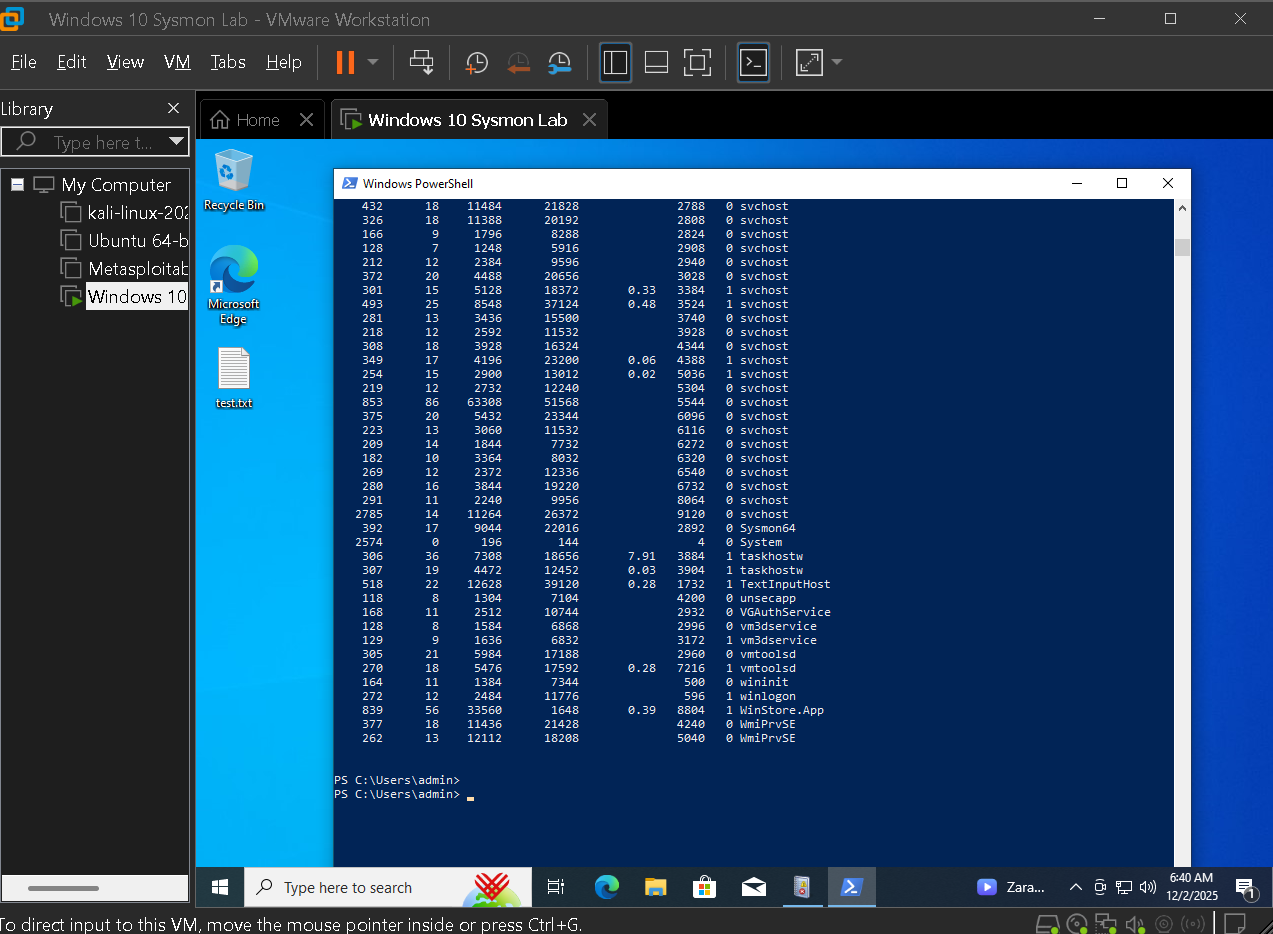
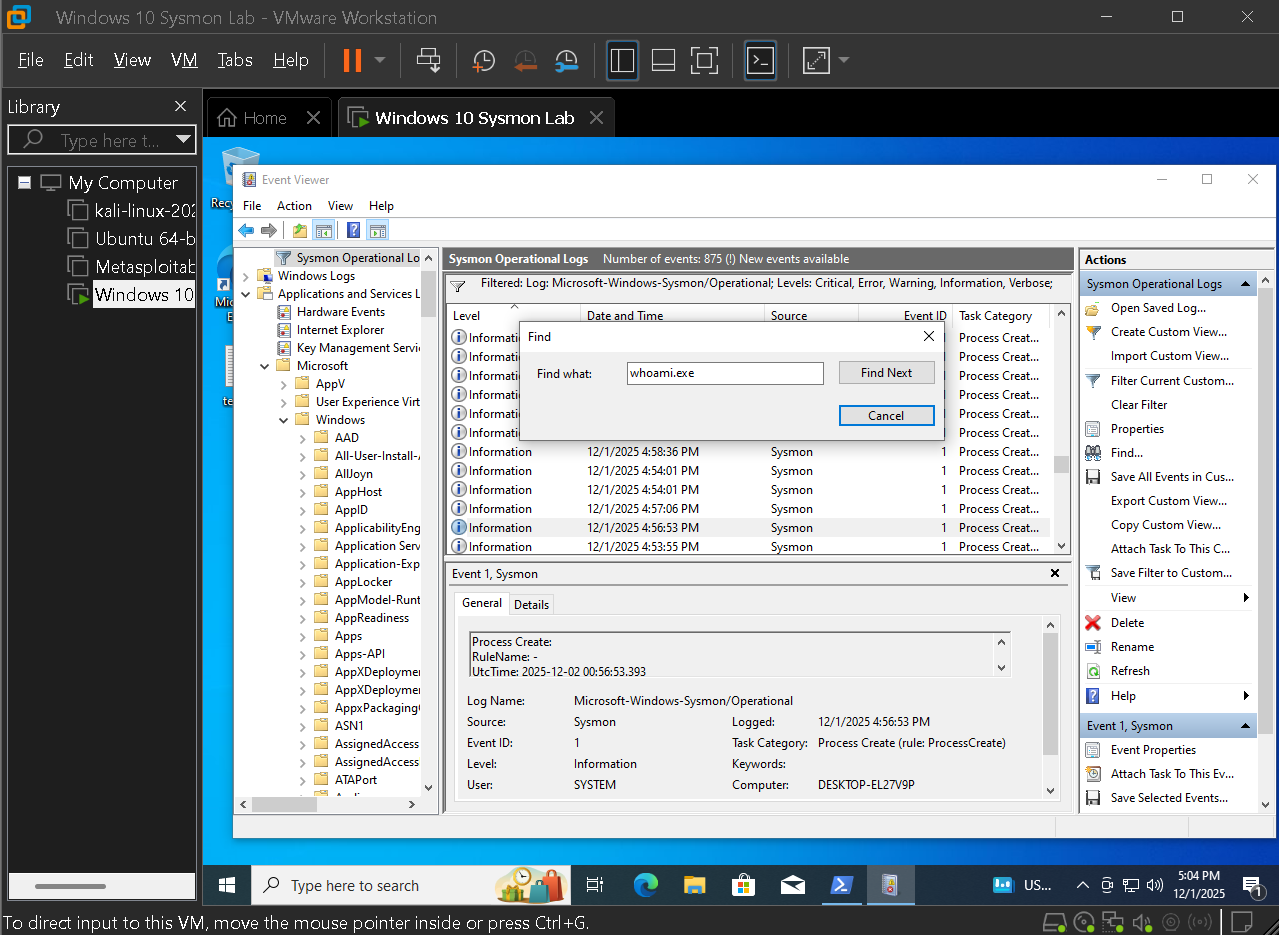
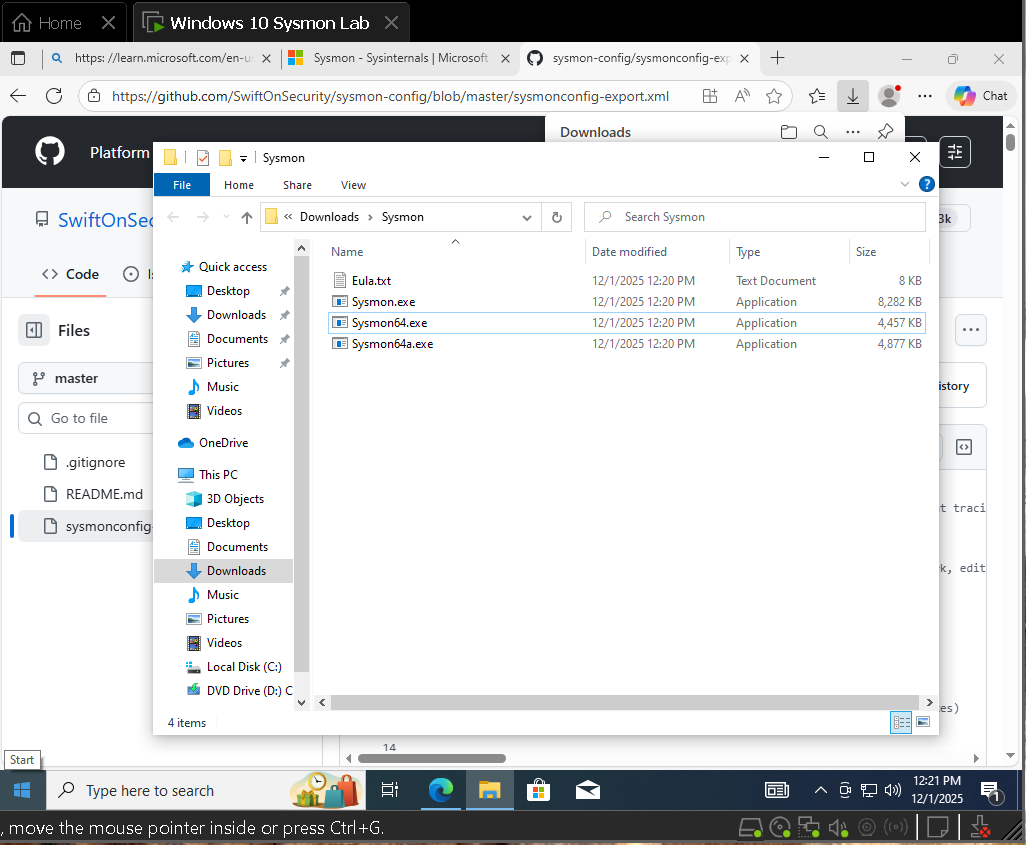
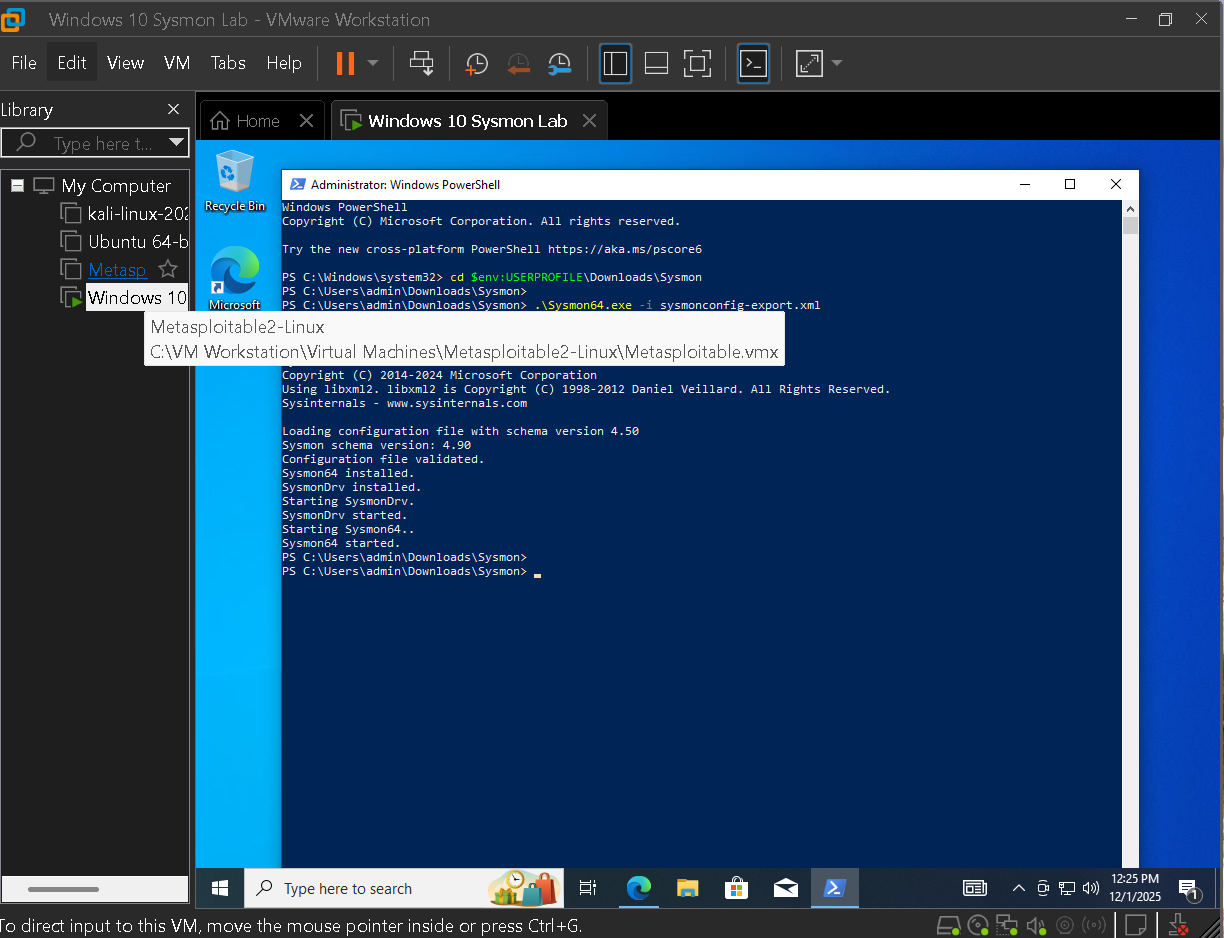
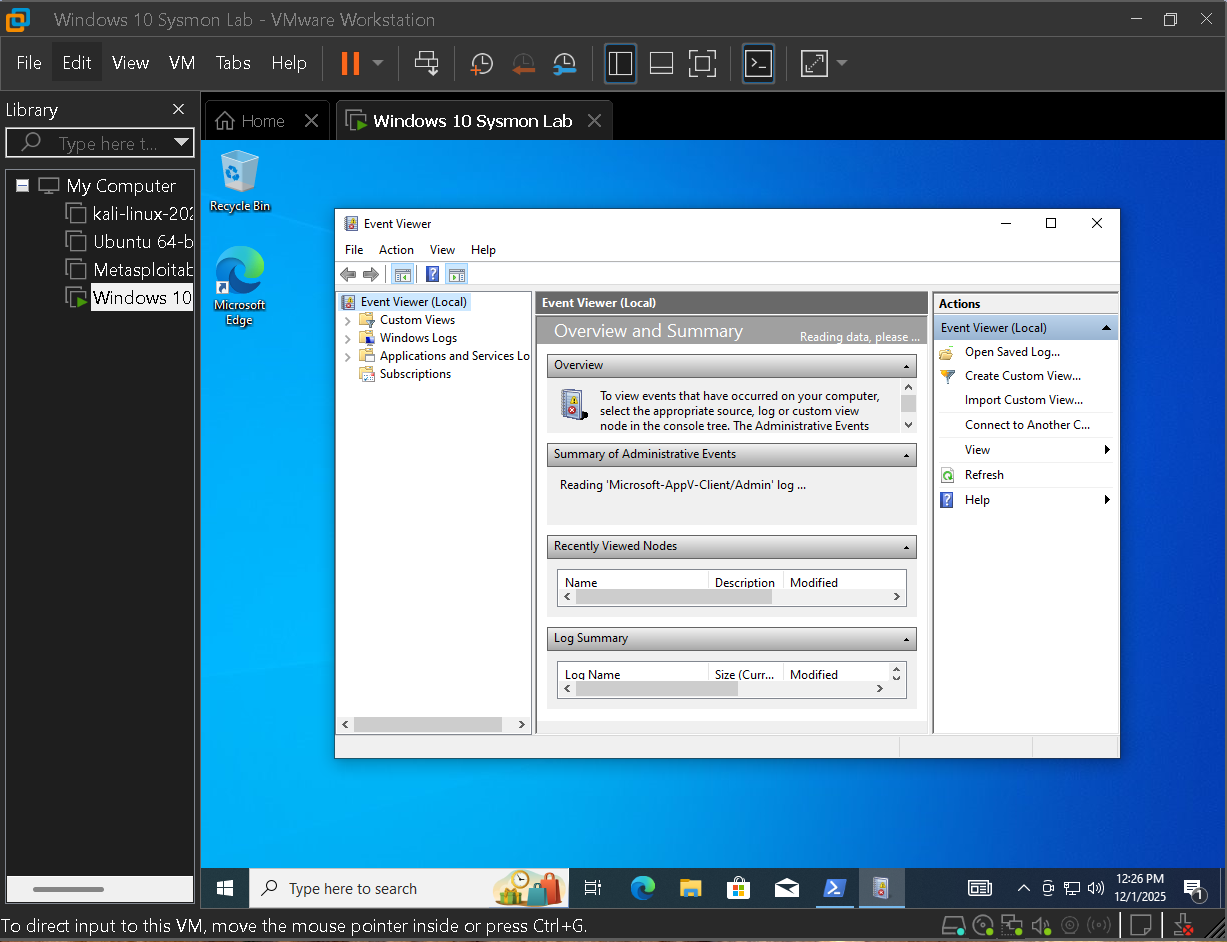
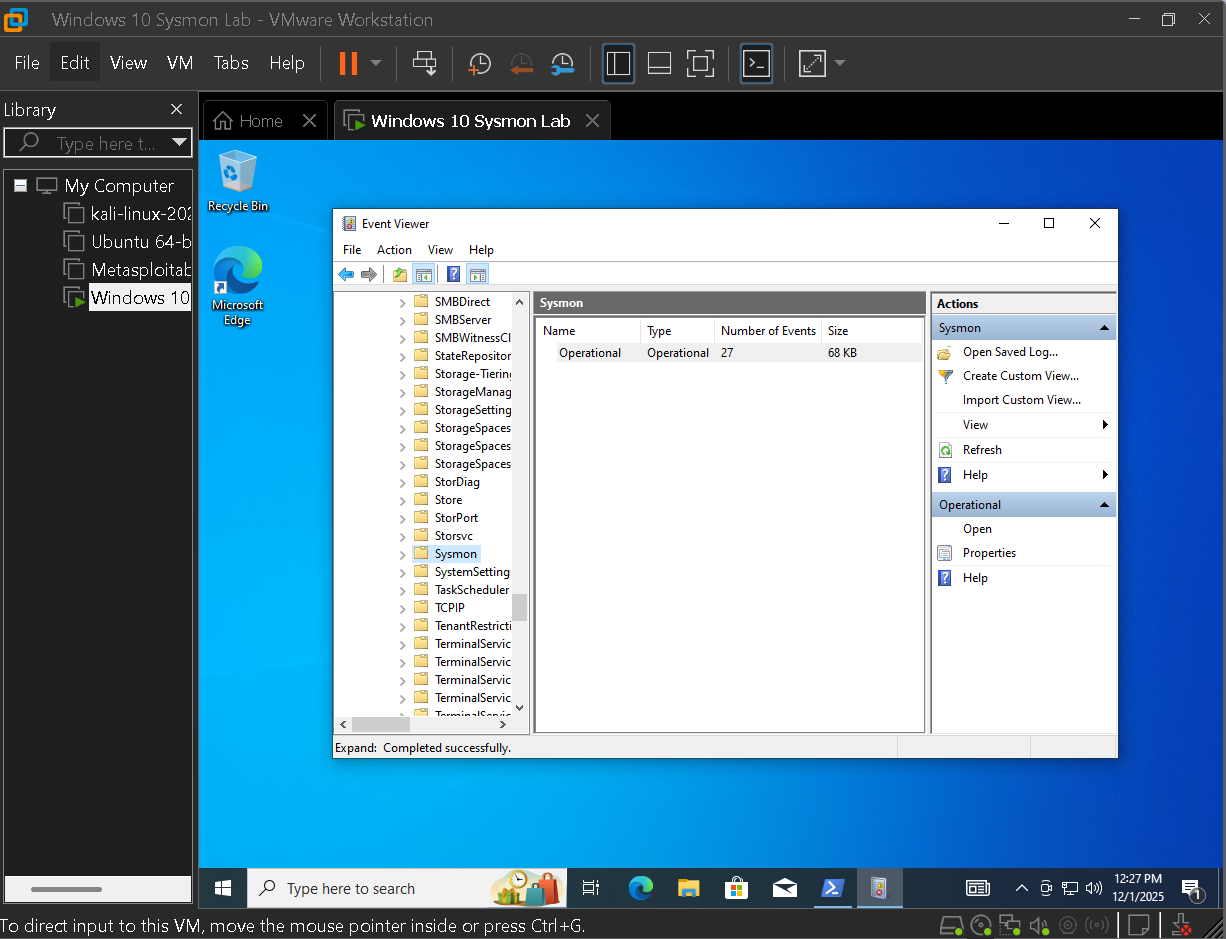
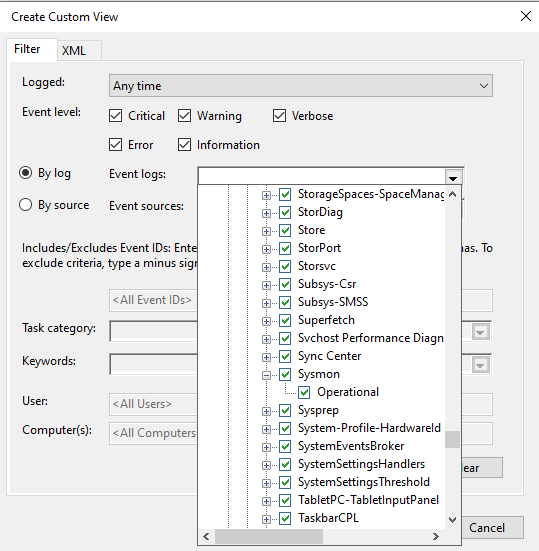
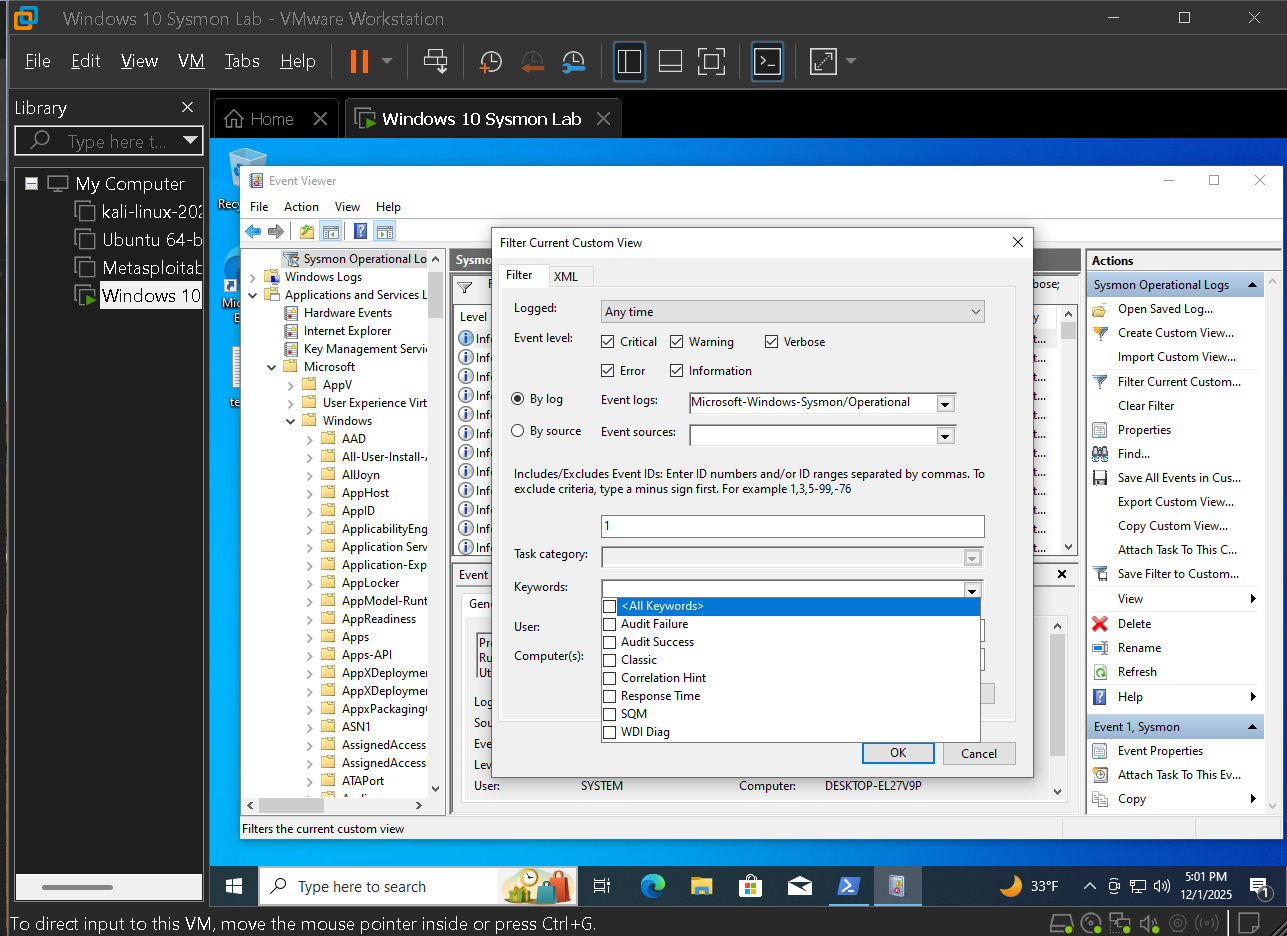
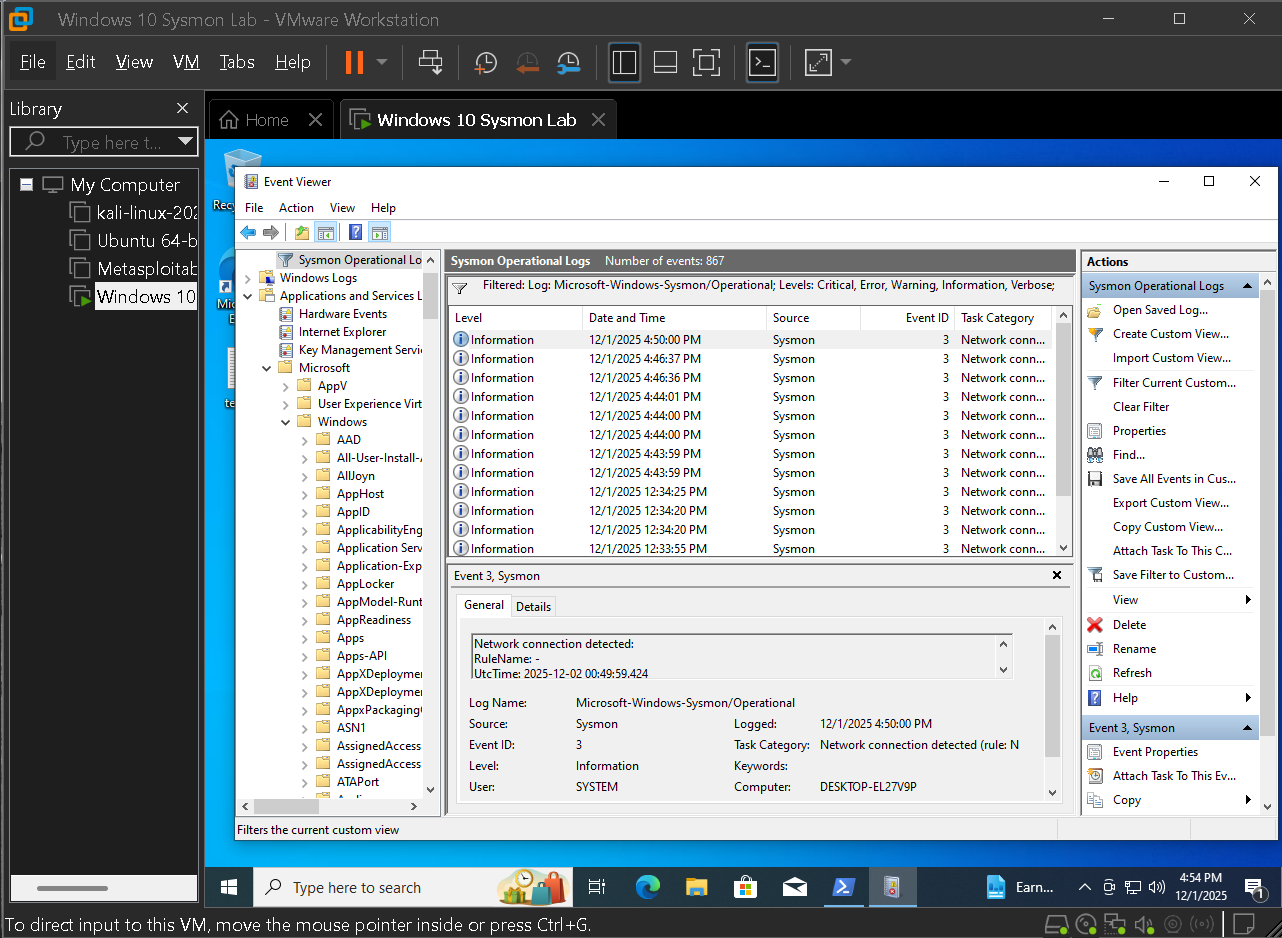
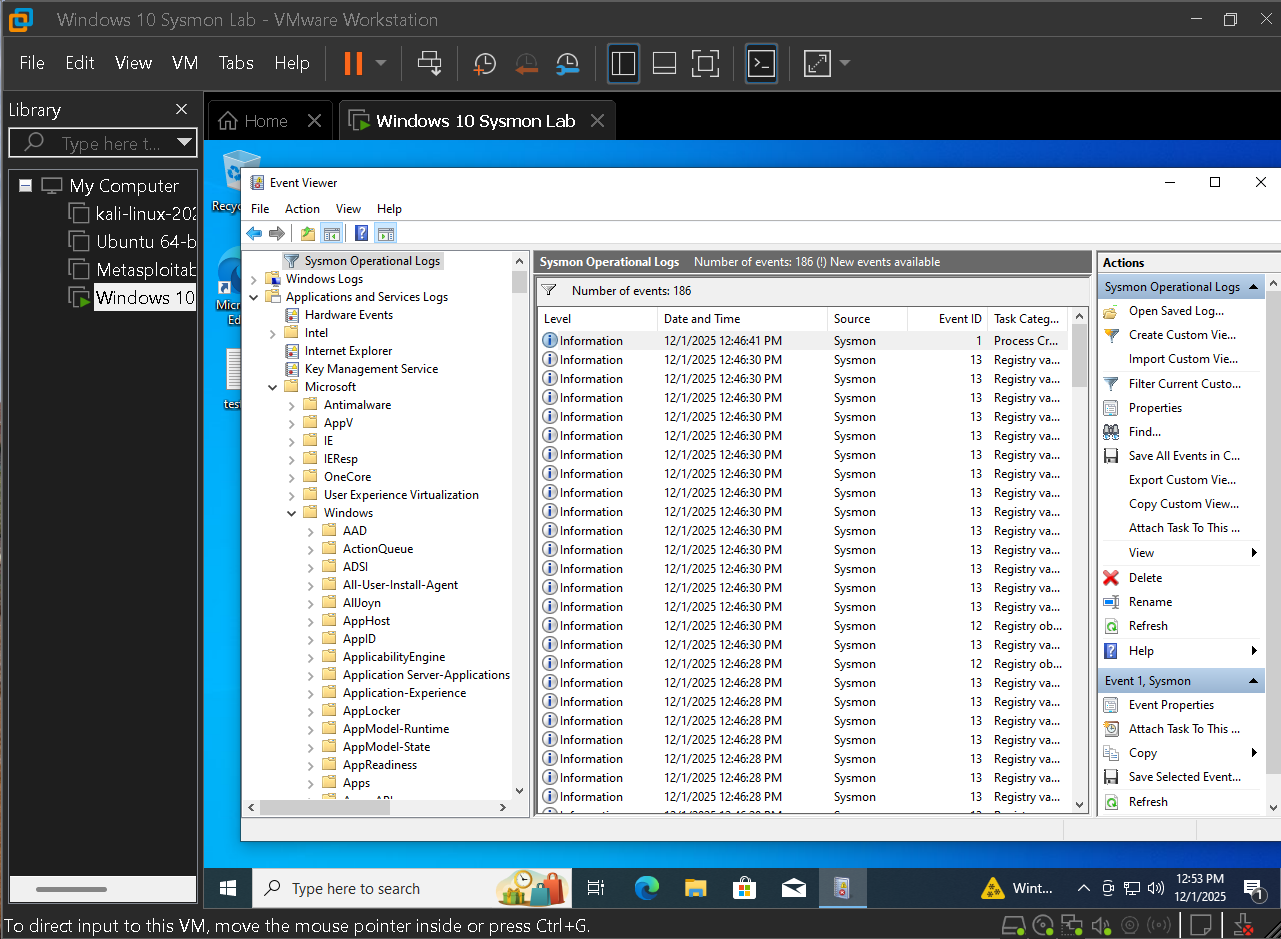
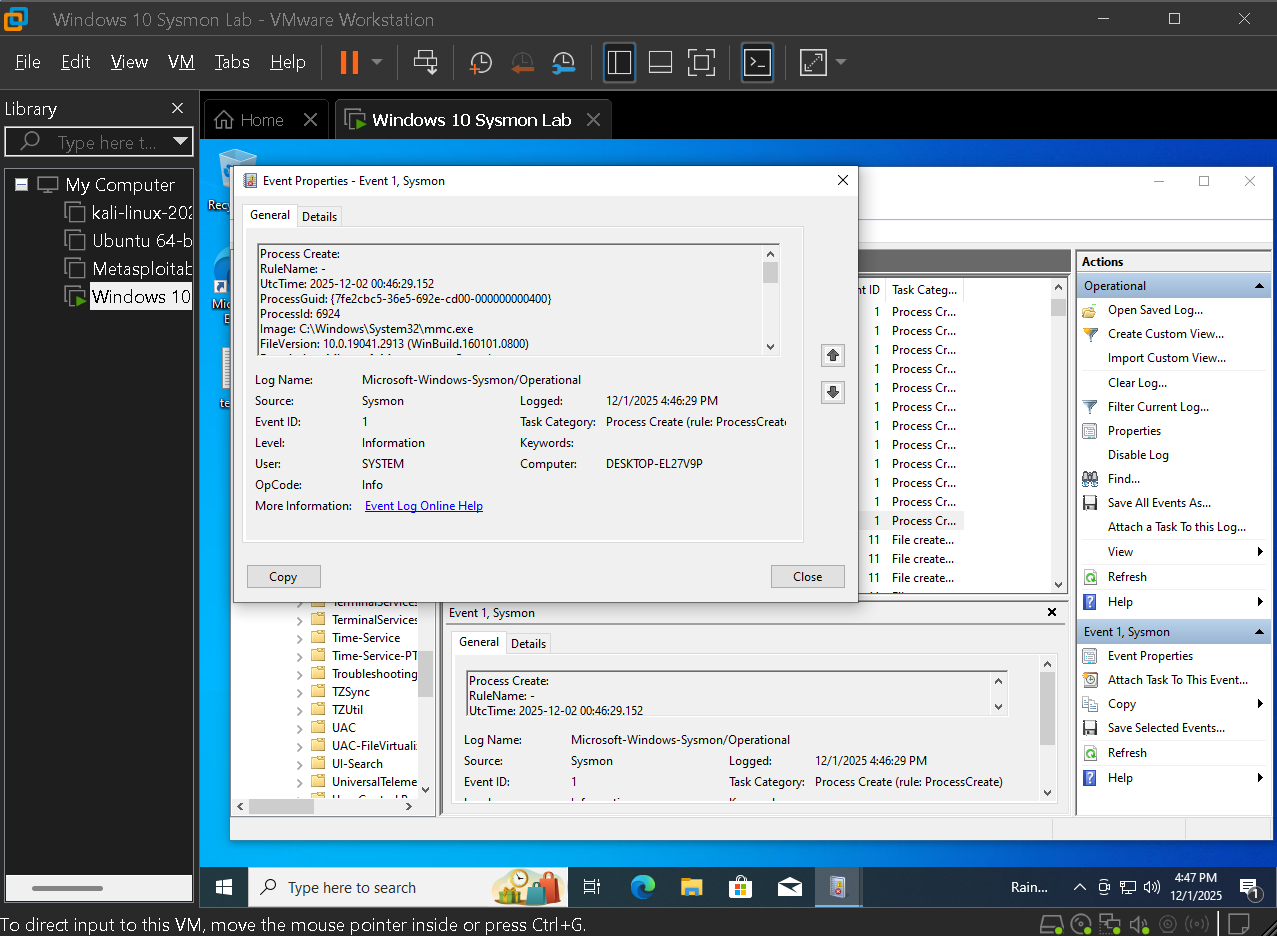
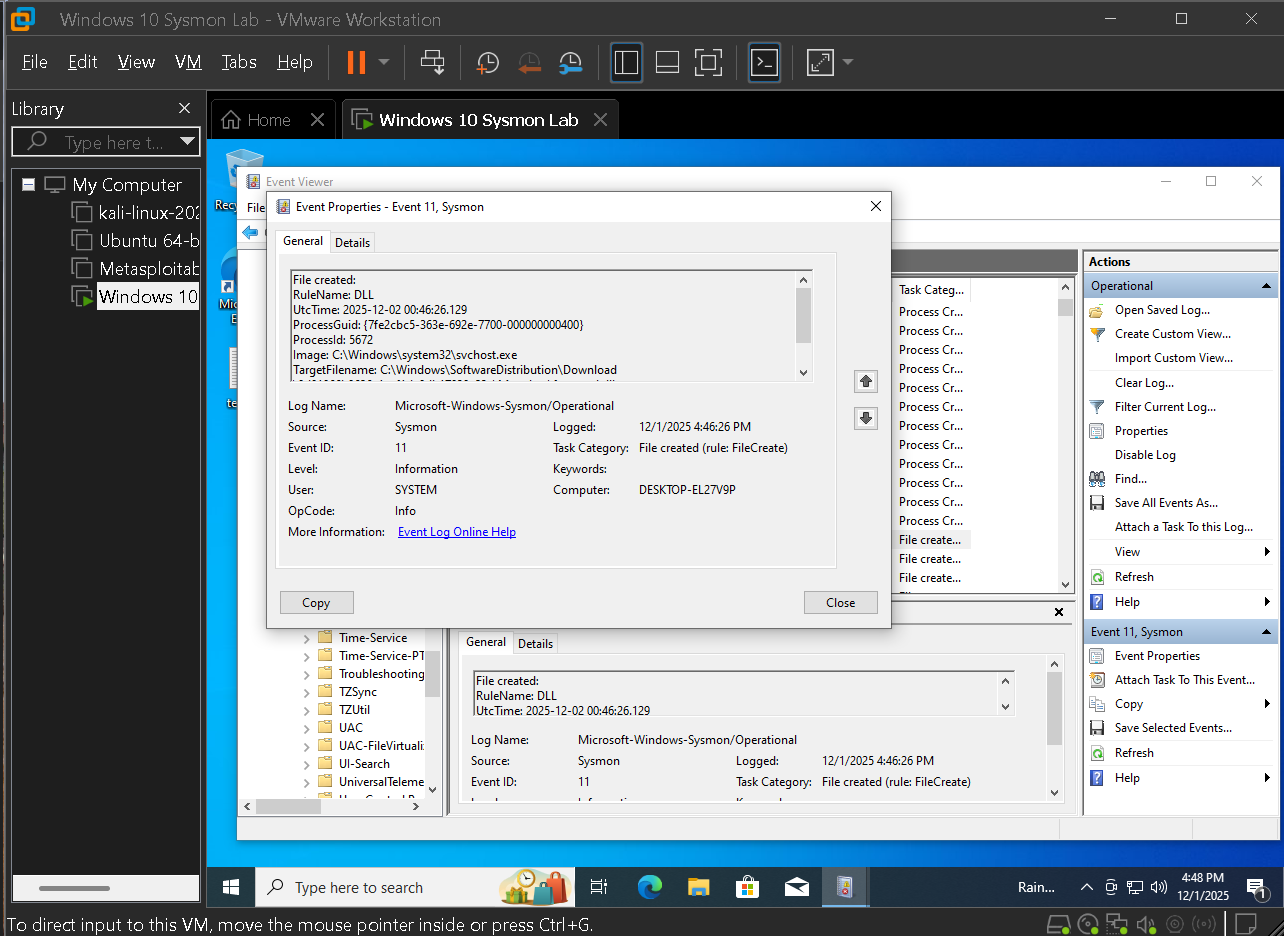
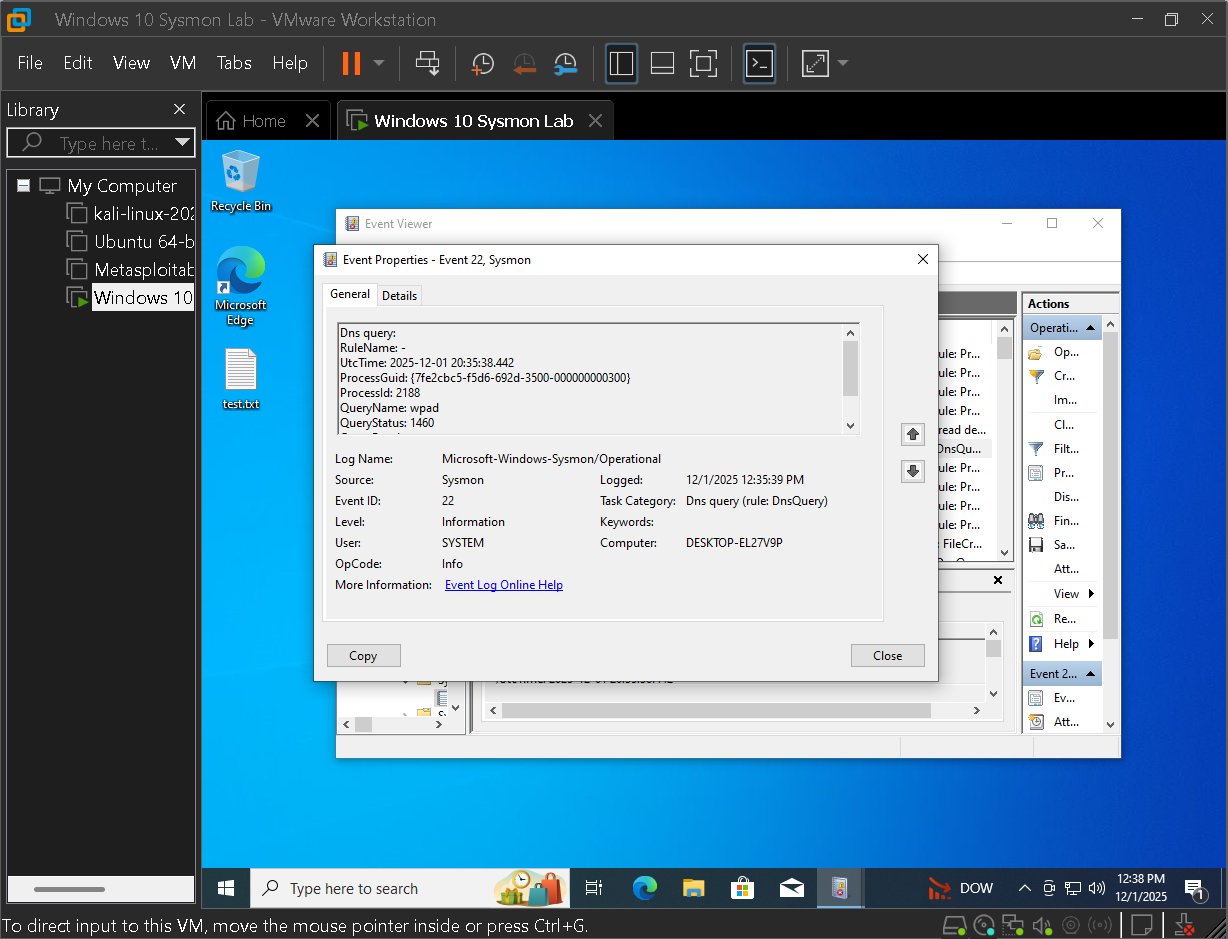
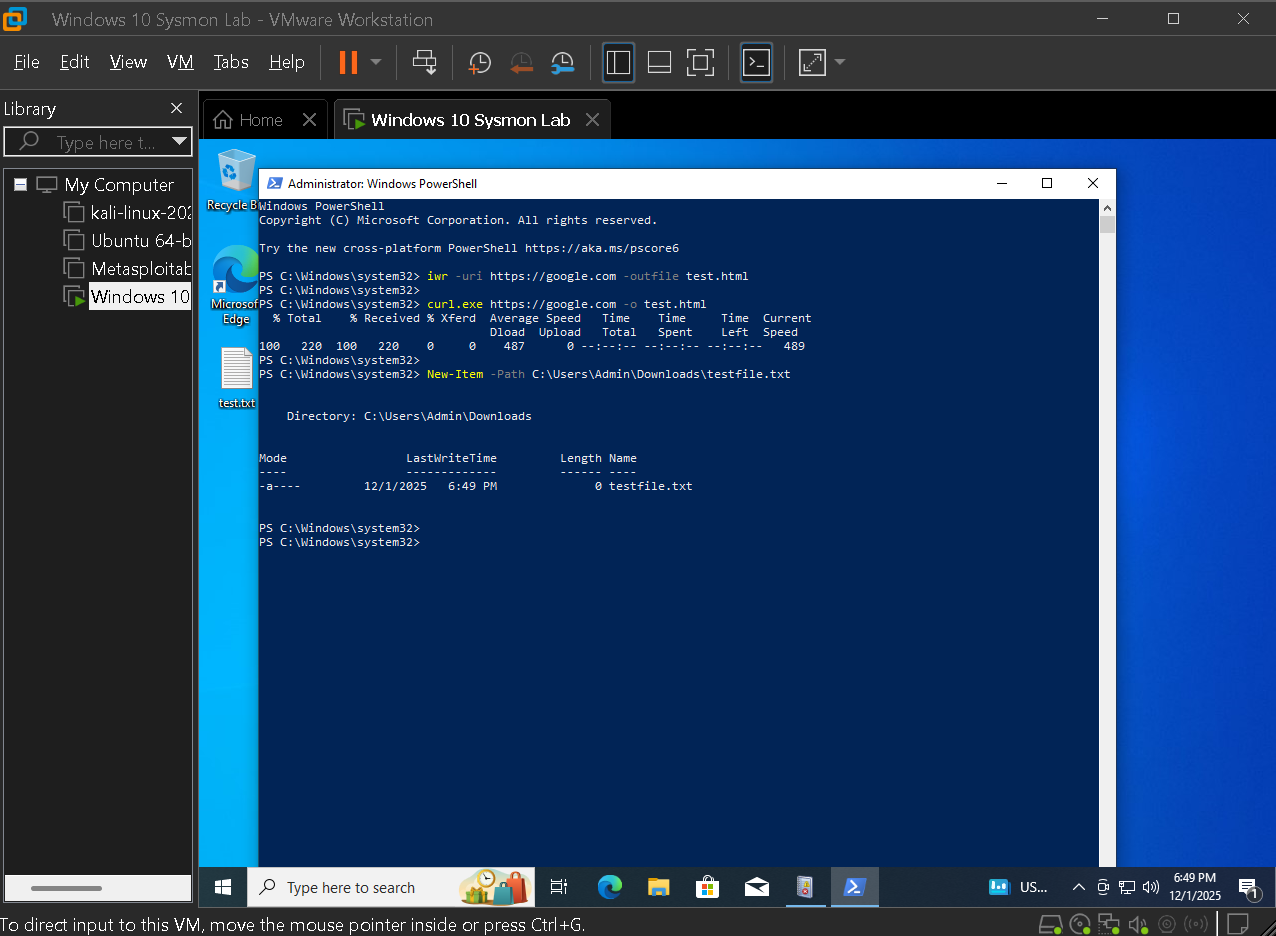
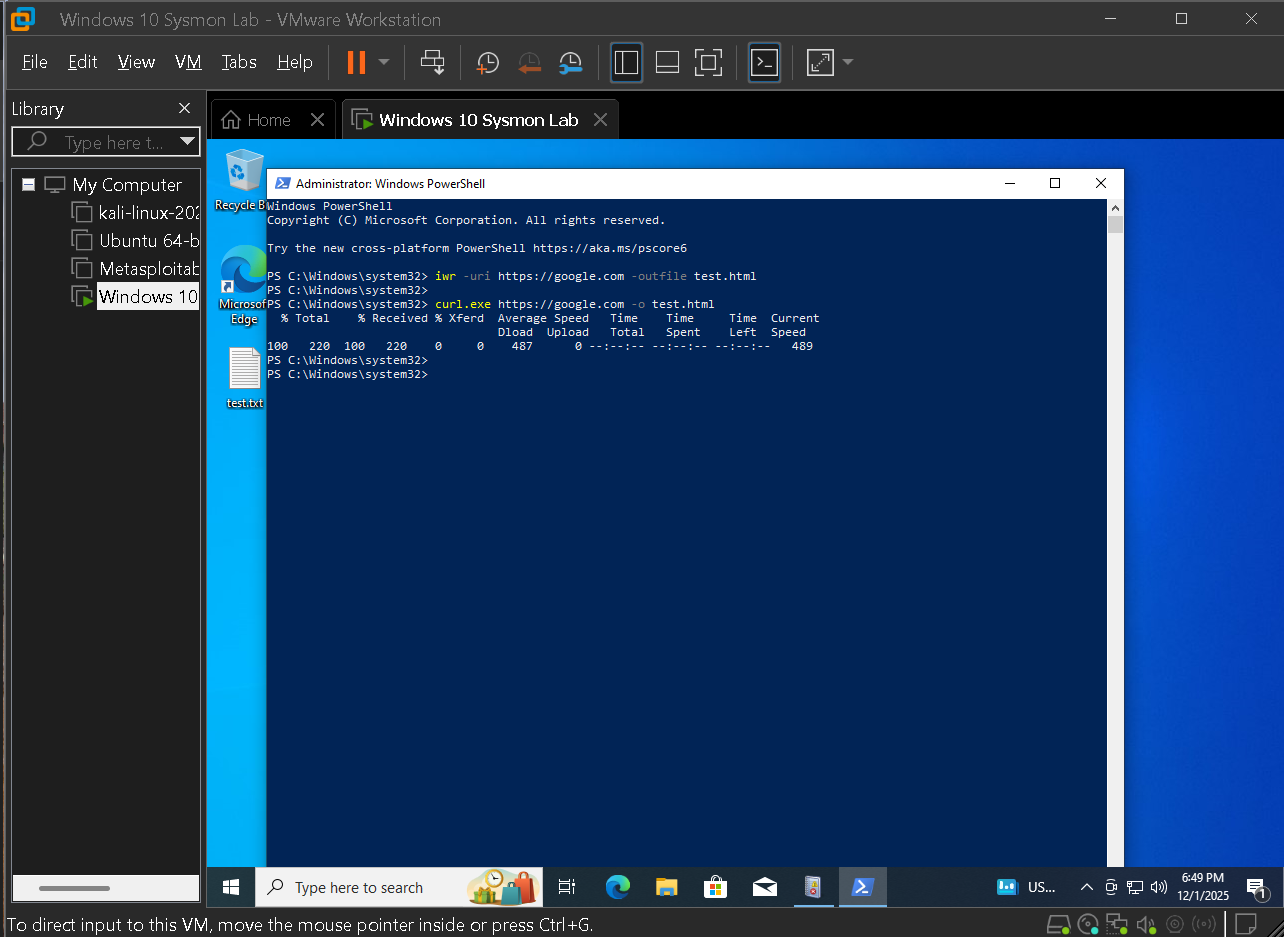
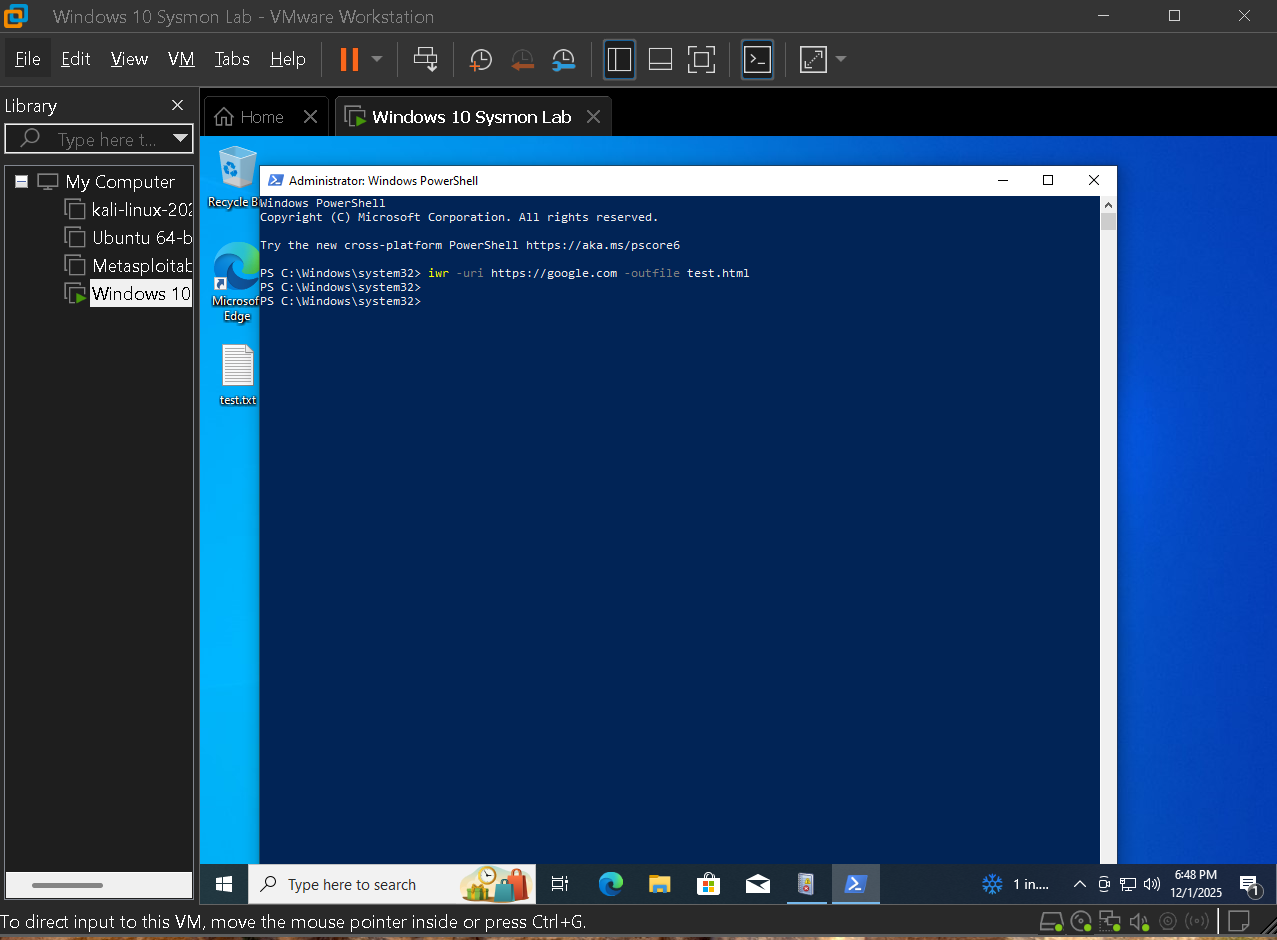
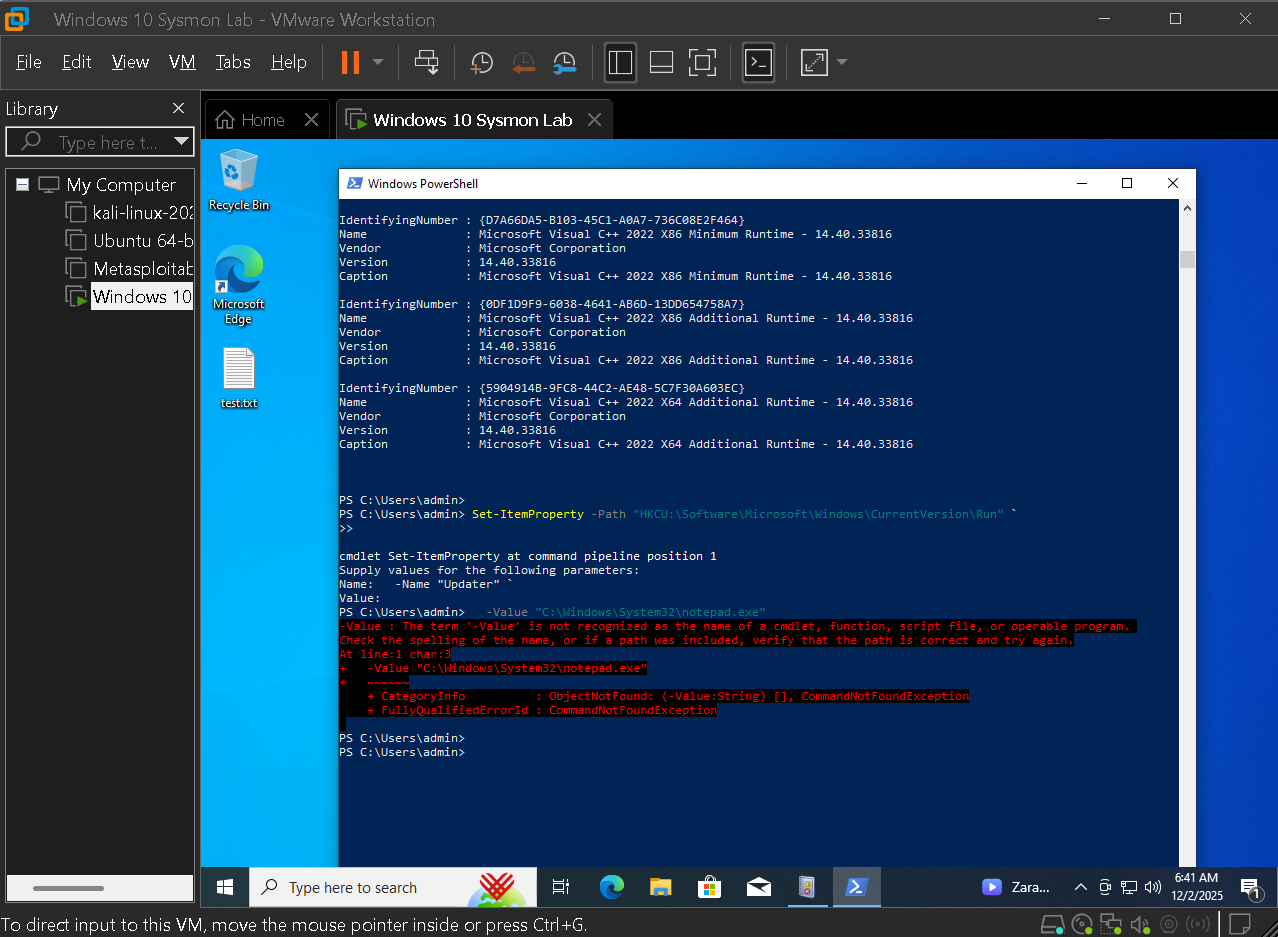
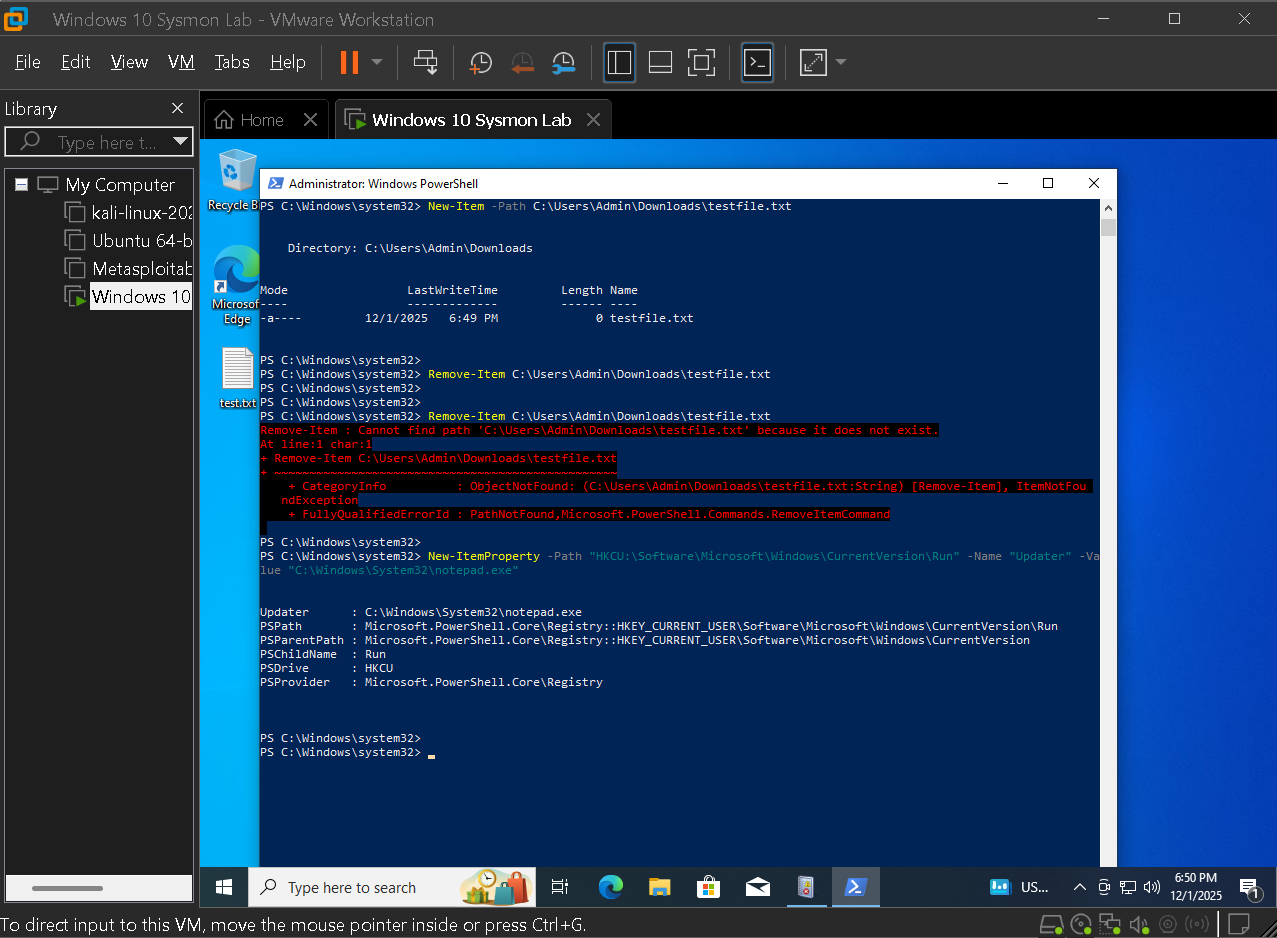
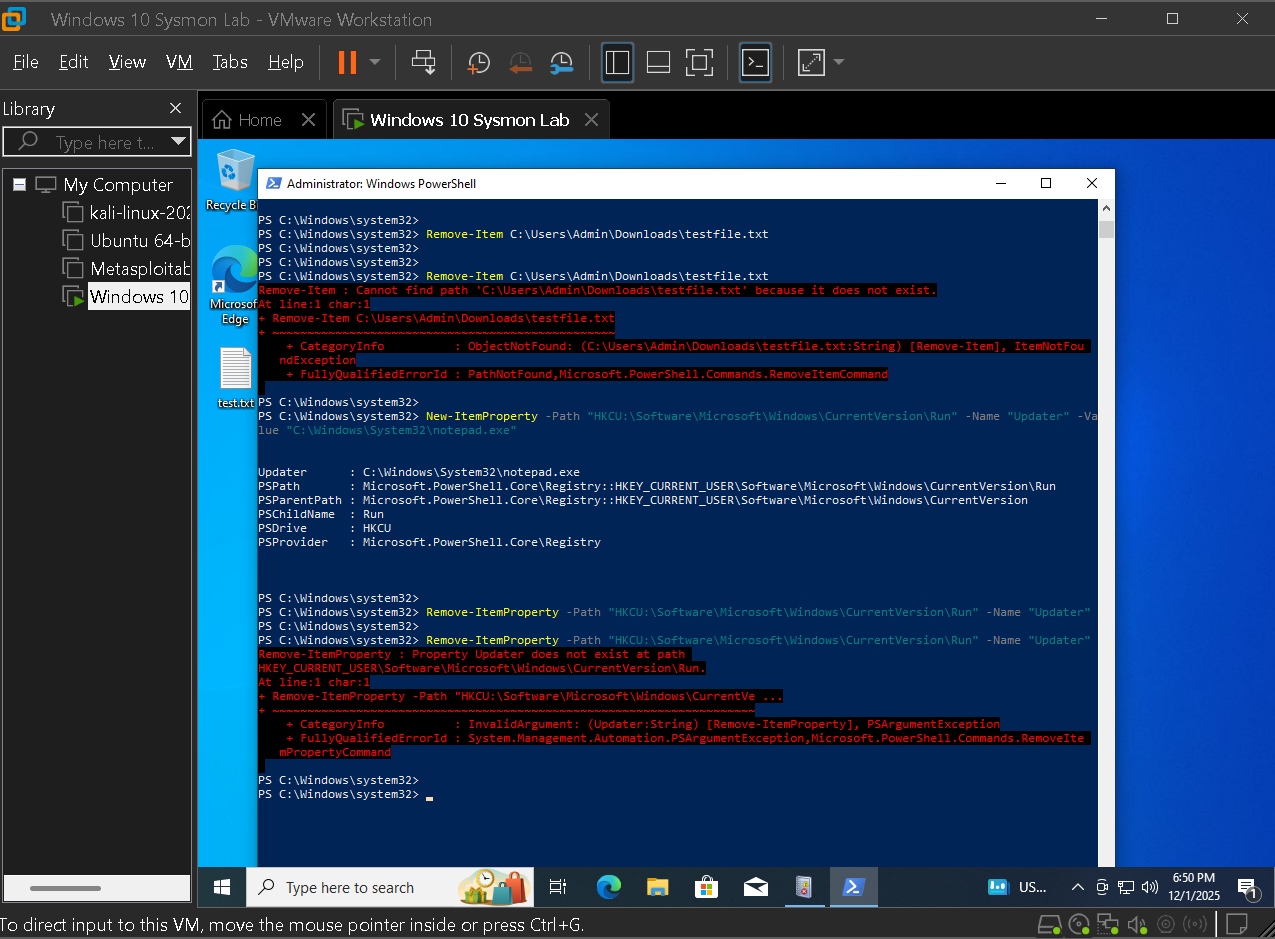
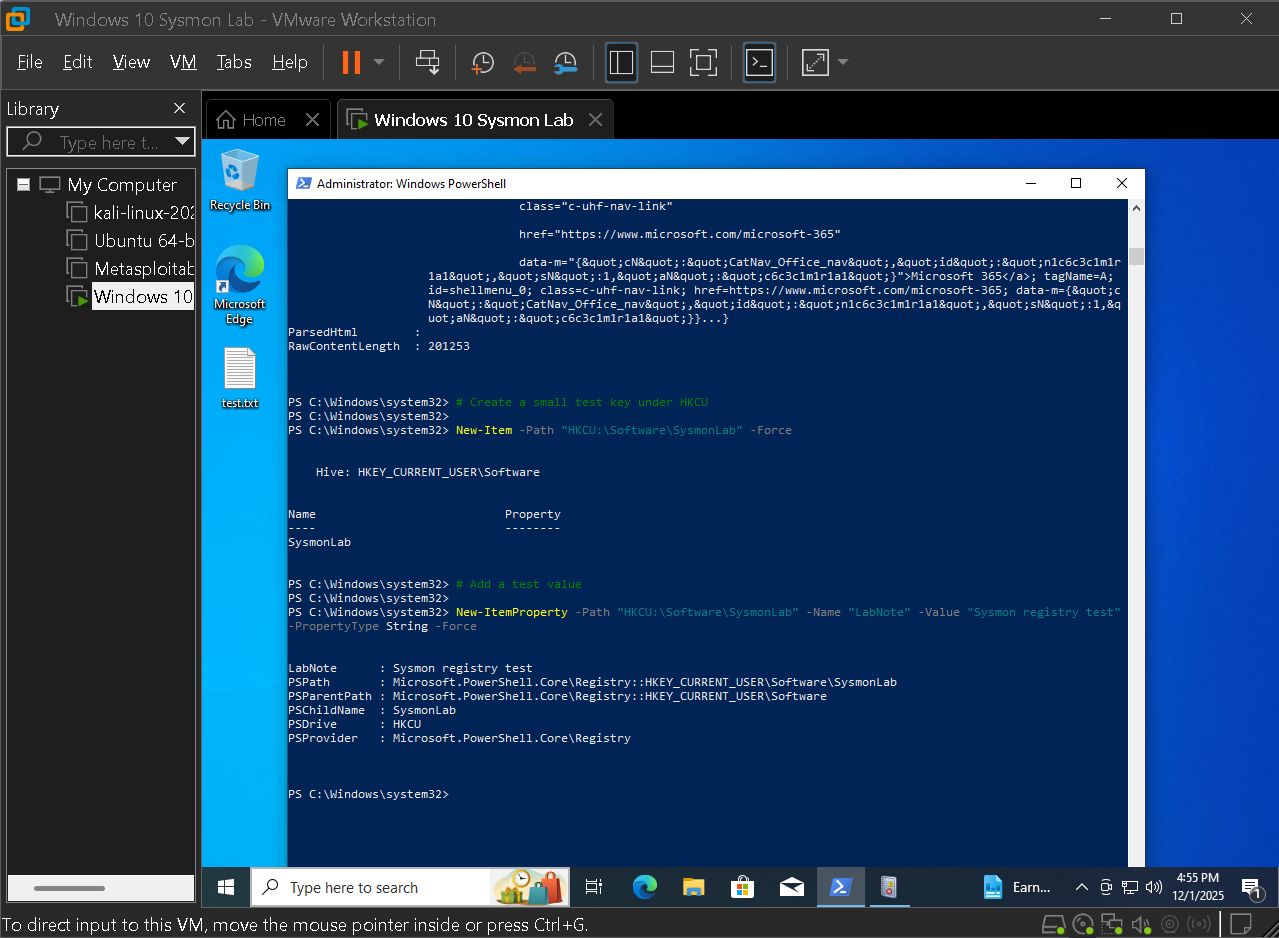
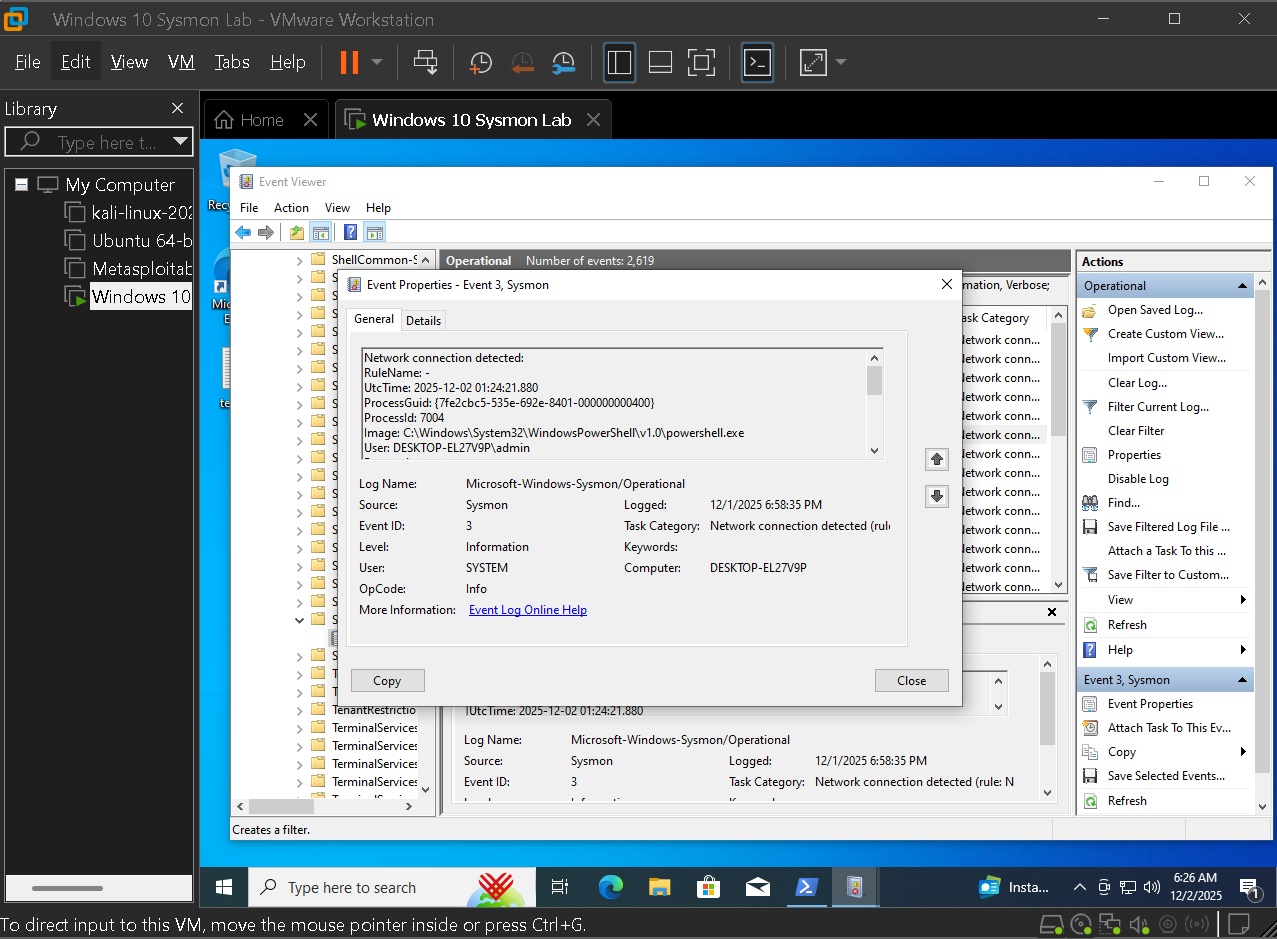
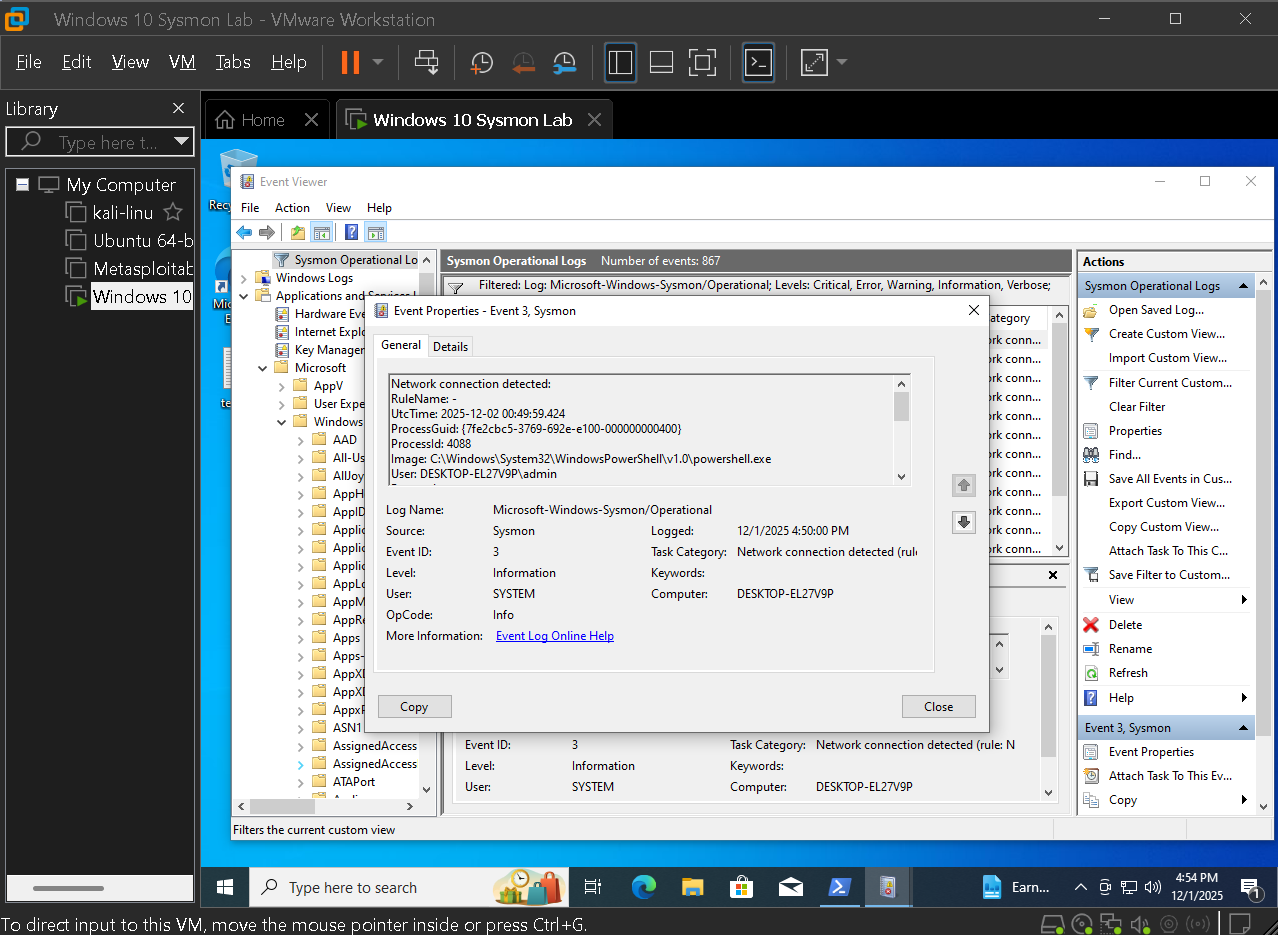
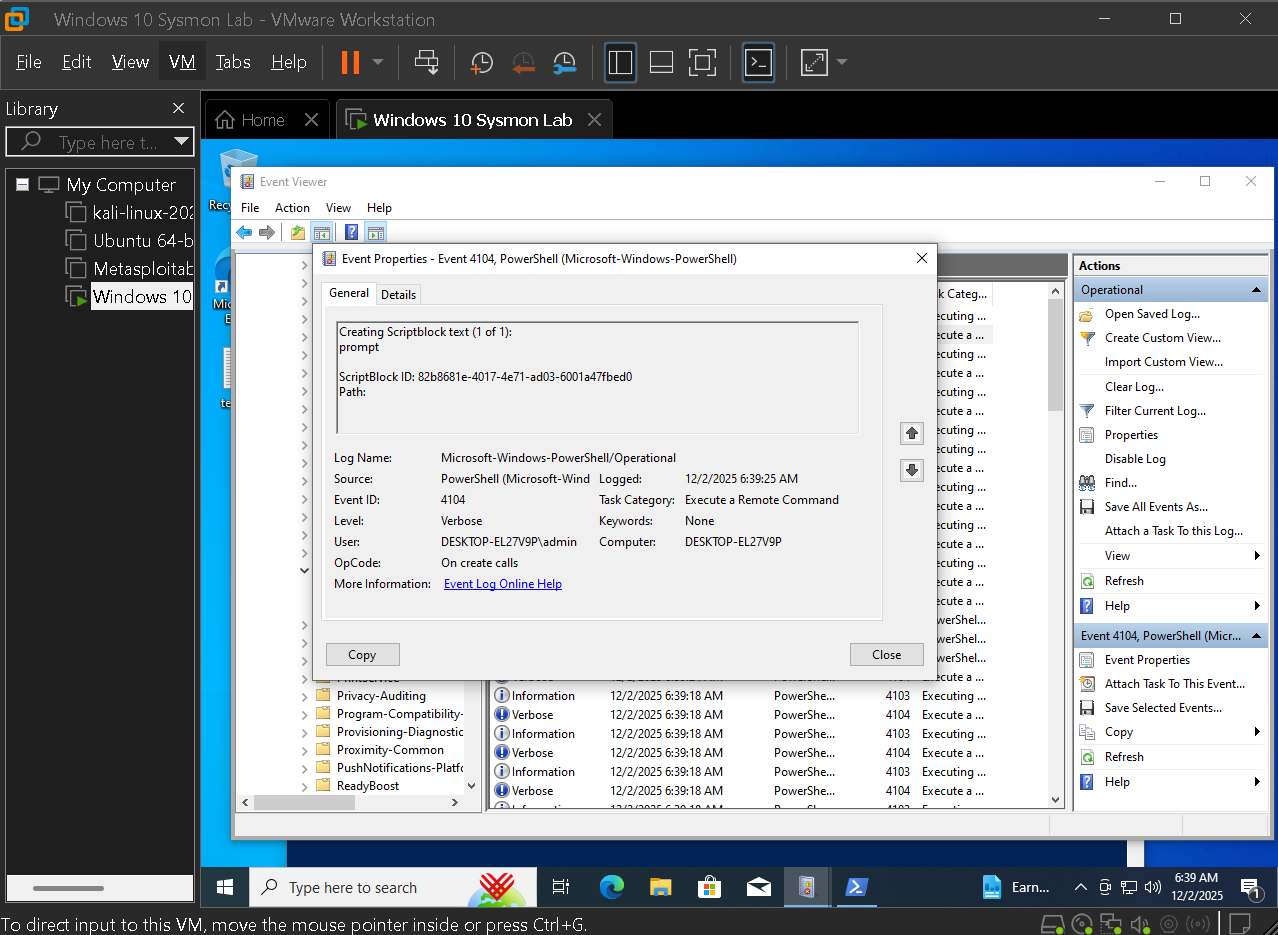
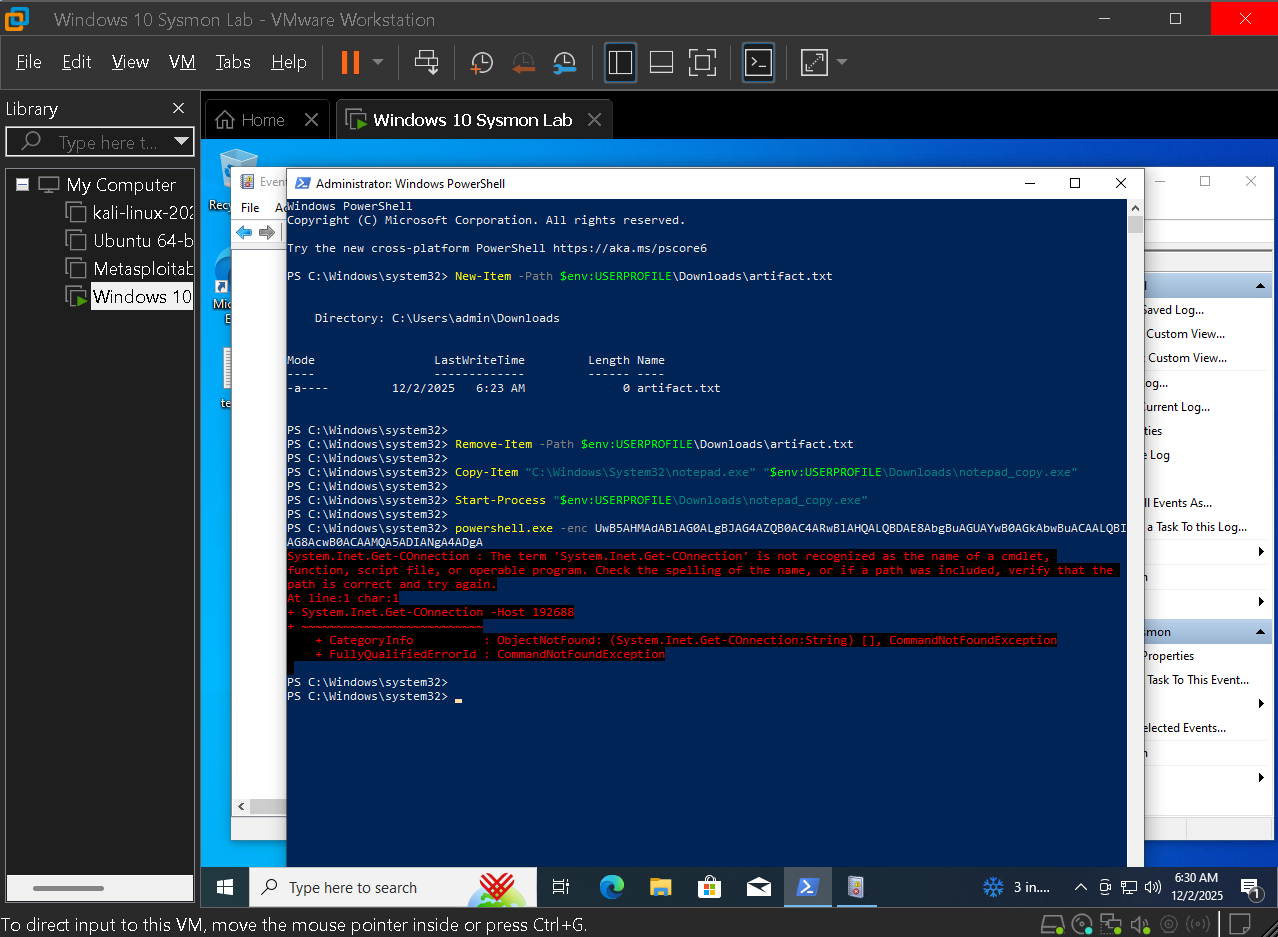
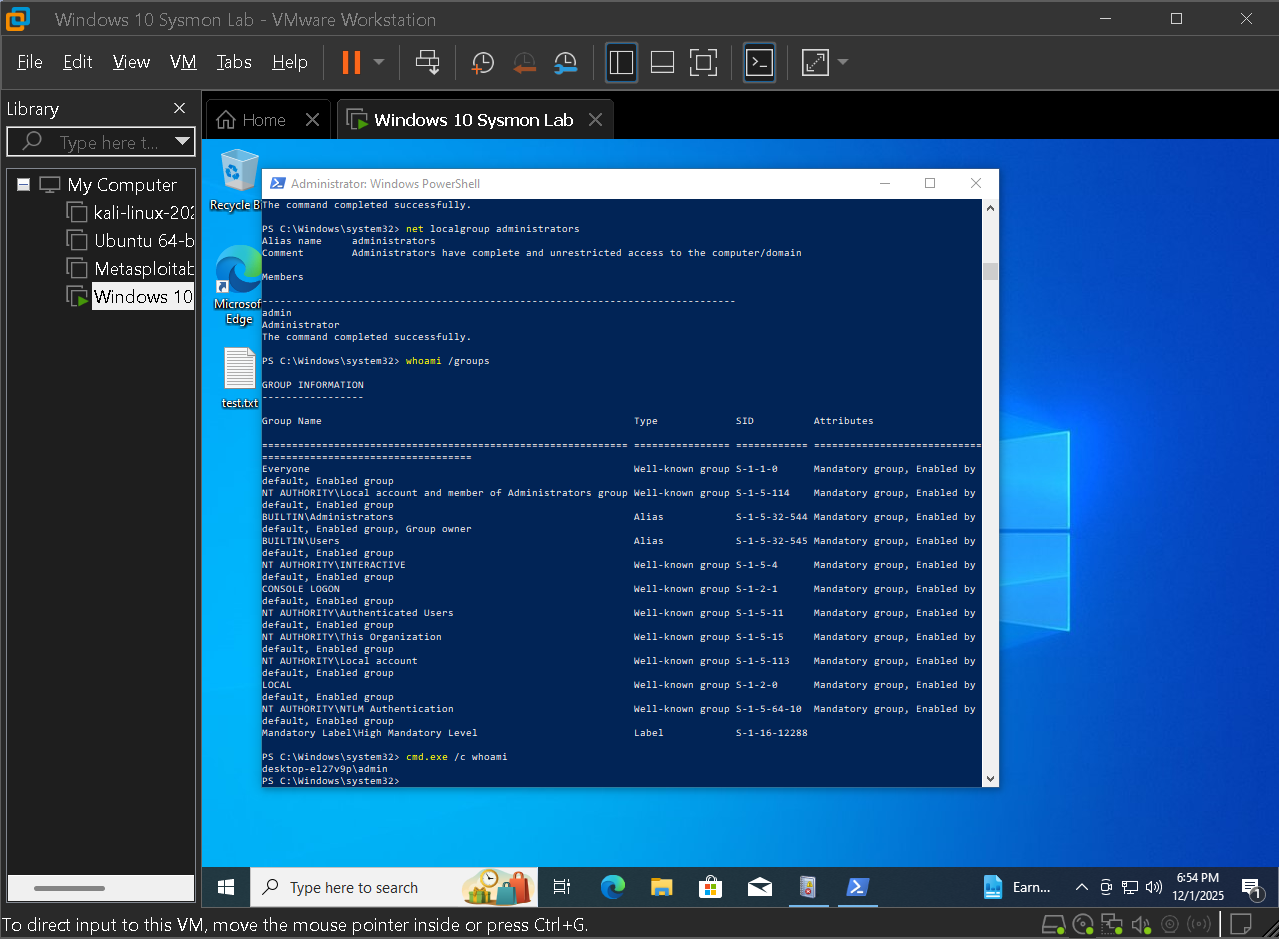
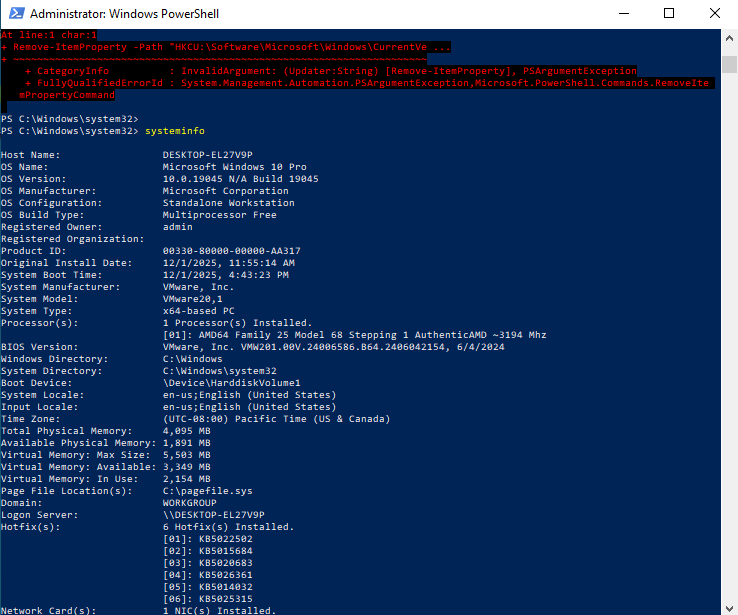
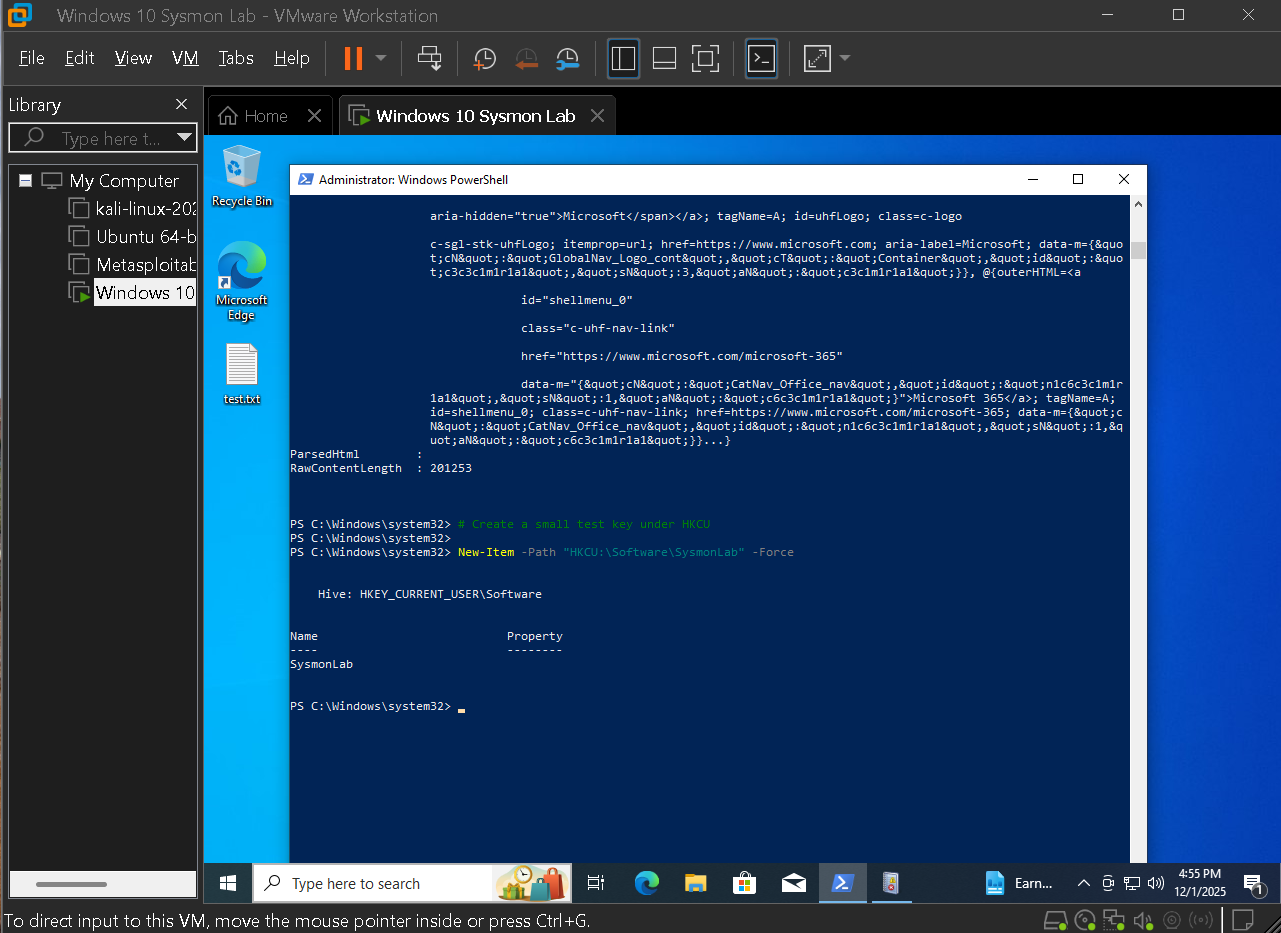
Starting from a fresh Windows 10 VM, privacy was locked down, the hardware profile was tuned, an analysis desktop was configured, and then Sysmon was deployed with a community configuration similar to what blue teams use in production. From there, high value event IDs were focused on and investigations that mirror real cases were walked through, such as LOLBin downloads, Run key persistence, encoded PowerShell commands, and command and control style traffic.

What was built

  • Windows 10 monitoring VM tuned for log analysis and low background noise
  • Sysmon deployment using an enterprise style community configuration with validated telemetry
  • Custom Event Viewer filters and views around high value Sysmon event IDs
  • Practical breakdown of process, network, file, registry, and DNS events
  • Simulated attacker activity and investigations based entirely on host logs
  • SOC style case structure with timelines, event references, and findings
  • MITRE ATT&CK mapping table linking activity to techniques and event IDs

Workflow Overview

Phase 1

Prepare host

Built a dedicated Windows 10 VM, hardened privacy settings, tuned hardware, and captured a quiet baseline.

Phase 2

Install Sysmon

Reviewed a community configuration, installed Sysmon, and validated that the Operational log recorded events.

Phase 3

Tune events

Built custom Event Viewer filters and views focused on high value Sysmon event IDs.

Phase 4

Hunt and simulate

Introduced attacker style behavior and used Sysmon logs to reconstruct activity chains.

Phase 5

Report and map

Documented cases in SOC templates and mapped them to MITRE ATT&CK techniques.

Lab Breakdown

Phase 1 — Windows VM preparation and lab baseline

The lab begins with a fresh Windows 10 virtual machine configured to behave like a simple corporate workstation while staying quiet enough that security artifacts stand out. Privacy settings were adjusted, the hardware profile was tuned, and an analysis desktop with PowerShell and Event Viewer was prepared ready for log review.

1.1 — Preparing the monitoring workstation

First a dedicated Windows 10 VM was created that serves as the monitored endpoint. Privacy settings were tightened and display options adjusted so that log viewers and consoles are readable side by side.

  • Tuned privacy options to reduce background noise
  • Adjusted hardware and display so analysis tools remain usable during long sessions
  • Designated this VM as a single monitored host for all Sysmon experiments
Windows 10 privacy settings

Windows 10 privacy settings minimized so normal background activity does not overwhelm Sysmon logs.

VM hardware and display

VM hardware and display tuned so PowerShell and Event Viewer are readable side by side.

1.2 — Establishing the lab desktop and first baseline

After the VM was tuned the desktop was arranged the way an analyst might use it on a real case. PowerShell is pinned and ready, and this quiet baseline becomes the reference point for all later simulations.

  • Created a stable desktop layout with consoles and tools in view
  • Took an early snapshot of the system so changes stay easy to see
  • Confirmed simple commands and shells work as expected
Windows host lab environment

Final Windows host layout used throughout the lab with PowerShell and core tools ready for analysis.

1.3 — Baseline process list and discovery commands

Before any simulated attacker behavior, a baseline of running processes and simple discovery commands was captured. Later investigations compare against this state to highlight unusual shells and additional tools.

  • Recorded a PowerShell process list for the clean system
  • Used commands such as whoami to create known good references
  • Verified that these actions appear as expected in later logs
Baseline PowerShell process list

Baseline PowerShell process list used later to spot additional shells during simulated attacks.

Whoami discovery command

Simple discovery command whoami captured for later comparison during post exploitation stages.

PowerShell process search

PowerShell based process search confirming which shells are active before attacker activity.

Key actions in this phase

  • Prepared a dedicated Windows 10 monitoring VM with tuned privacy and hardware settings
  • Established a stable desktop and PowerShell workflow as the analysis surface
  • Captured baseline discovery commands and process lists for future hunting work

Phase 2 — Sysmon installation and configuration

With the host ready, focus shifted to deploying Sysmon and understanding the configuration that decides what gets recorded. The goal was not only to enable logging but to explain which behaviors generate telemetry and why.

2.1 — Reviewing a community Sysmon configuration

A popular community Sysmon configuration from GitHub was reviewed. This shows which event IDs are enabled and how noise is filtered, which is critical before relying on the log stream for detection.

  • Examined enabled event IDs and filtering logic
  • Confirmed coverage for process, file, registry, DNS, and network events
  • Used the configuration as the baseline for all lab tests
Sysmon configuration on GitHub

Reviewing a community Sysmon configuration to see enabled event IDs and initial noise filtering rules.

2.2 — Installing Sysmon and validating the service

Sysmon was installed from an elevated console using the reviewed configuration. The successful install confirms driver and service registration, which is important before trusting any new events.

  • Ran Sysmon install with configuration from an admin console
  • Validated that the service and driver registered correctly
  • Confirmed that the Sysmon Operational channel appeared in Event Viewer
Sysmon install success

Sysmon installation from an elevated console confirming driver and service registration on the host.

2.3 — Comparing default Windows logs to Sysmon telemetry

After installation Event Viewer was opened and the default Windows logs were compared to the new Sysmon Operational channel. This contrast highlights how much additional detail Sysmon provides.

  • Viewed standard Windows logs before any tuning
  • Switched to the Sysmon Operational channel to watch events in real time
  • Confirmed that Sysmon events flowed as soon as the host was active
Initial Event Viewer view

Initial Event Viewer view before any tuning, showing standard Windows logs.

Sysmon Operational log

Sysmon Operational channel selected and streaming events in real time after installation.

2.4 — Focusing Event Viewer on Sysmon as a source

To keep investigations focused Event Viewer was filtered to show only Sysmon as the event source. This prevents mixing providers and keeps the console anchored on high fidelity telemetry.

  • Filtered events by the Sysmon provider
  • Verified that new process and network activity appeared in this view
  • Used this focused channel as the base for all later filters and views
Event Viewer filter by source

Event Viewer filtered by Sysmon event source so the console remains focused on high fidelity telemetry.

Key actions in this phase

  • Selected and reviewed a community Sysmon configuration prior to deployment
  • Installed Sysmon as a persistent service and confirmed successful registration
  • Validated that the Sysmon Operational channel was present, active, and filtered correctly

Phase 3 — High value event IDs and log filtering

Once events were flowing the view was tuned to keep threat hunting focused on telemetry that matters. Instead of scrolling through every entry, custom Event Viewer views were built around specific Sysmon event IDs that map directly to attacker behavior.

3.1 — Building a custom Sysmon centered view

Custom views keep investigations fast and repeatable. A small set of high value event IDs was selected for process creation, file writes, registry changes, DNS queries, and network connections.

  • Created a custom view for core Sysmon event IDs
  • Anchored later cases to the same filtered view for consistency
  • Documented which IDs are most useful for detection work
Custom view for Sysmon event IDs

Custom Event Viewer view built around a small set of high value Sysmon event IDs used throughout the lab.

3.2 — Isolating network and registry activity

Network (Event ID 3) and registry value set (Event ID 13) events are powerful but noisy. Targeted filters allow quick spotting of suspicious connections and persistence without drowning in volume.

  • Created a dedicated filter for Event ID 3 to hunt for C2 traffic
  • Reviewed Event ID 13 volume to understand baseline registry activity
  • Used these filters later to catch Run key persistence and beacon behavior
Network filter for Event ID 3

Filter isolating Event ID 3 network connection events for targeted C2 and beacon hunting.

High volume registry events

High volume of Event ID 13 registry value set events showing why tuning and context are required.

3.3 — Representative events for core behaviors

Representative examples were captured for each major event type that appears in later investigations. These anchor cases and make it easier to explain findings to other analysts.

  • Process creation events (Event ID 1) showing parents and full command lines
  • File create events (Event ID 11) used in payload and DLL drop tests
  • Registry value set events (Event ID 13) that become the core signal for Run key persistence
  • DNS query events (Event ID 22) that tie network behavior to remote domains
Sysmon Event ID 1 process create

Sysmon Event ID 1 process creation event showing parent, image path, and full command line.

Sysmon Event ID 11 file create

Sysmon Event ID 11 file create event capturing a DLL written to disk during a test sequence.

Sysmon Event ID 13 registry value set

Sysmon Event ID 13 registry value set event later used as the primary indicator for Run key persistence.

Sysmon Event ID 22 DNS query

Sysmon Event ID 22 DNS query event showing the domains contacted by processes under test.

Key actions in this phase

  • Built a custom Event Viewer view centered on high value Sysmon event IDs
  • Demonstrated why noisy registry and network logs need focused filters before analysis
  • Captured detailed examples of process, file, registry, and DNS events for case building

Phase 4 — Threat hunting and attack simulation

With telemetry tuned realistic behavior was introduced in stages: normal browsing, file creation, LOLBin downloads, registry based persistence, and command and control style traffic. Every step is visible in Sysmon and becomes part of a reconstructed story.

4.1 — Normal browsing and file activity

Harmless activity such as browser launches and simple file creation was started with. This establishes what normal user actions look like in Sysmon before more suspicious behavior appears.

  • Launched a browser and observed generated process and network events
  • Created test files to compare against later payload drops
  • Confirmed these benign actions appear in the tuned views as expected
Baseline browser launch

Baseline browser launch showing how normal web usage appears in Sysmon before simulated attacks.

Test file creation

Harmless test file creation used to compare against later payload and DLL drop activity.

4.2 — LOLBin style downloads using built in tools

Built in tooling was used to download content from remote servers. This demonstrates how attackers blend with administrator style actions and why defenders must focus on behavior rather than tool names.

  • Used curl like syntax in PowerShell to pull a remote file
  • Repeated the test with Invoke WebRequest to compare the resulting logs
  • Validated that Sysmon captured both process and network details
Curl style PowerShell download

Curl style PowerShell download used to test whether Sysmon captures process and network details.

Invoke WebRequest download

Alternate download using Invoke WebRequest, showing how similar behavior appears with a different command.

4.3 — Registry based persistence through Run keys

Persistence was simulated by setting a Run key value that points to a payload. Viewing the change from both attacker and defender perspectives shows how a single action surfaces as PowerShell, registry, and process events.

  • Used PowerShell to configure a Run key entry for persistence
  • Verified that the change appeared as Event ID 13 in Sysmon
  • Attempted to remove the key to show that cleanup is also visible
Run key set via PowerShell

PowerShell Set ItemProperty command used to configure a Run key based persistence mechanism.

Run key configuration view

Defender view of the resulting Run key entry used to launch the payload at logon.

Run key removal attempt

Attempt to remove the persistence key, showing how cleanup attempts are also visible in registry events.

Registry value set event for persistence

Sysmon Event ID 13 entry representing the Run key value set that underpins the persistence case.

4.4 — Command and control style network behavior

To simulate command and control outbound connections were generated from PowerShell to a remote host and the resulting Event ID 3 and related entries were watched. Repeated connections mimic beacon behavior that a SOC would flag for investigation.

  • Generated outbound connections that resemble beacon traffic
  • Used Event ID 3 to tie PowerShell activity to a specific host and port
  • Prepared data that feeds directly into MITRE mapping for C2 techniques
Sysmon Event ID 3 network connection

Sysmon Event ID 3 network connection linking PowerShell to an external command and control host.

Beacon style Event ID 3 activity

Beacon style Event ID 3 network activity showing repeated connections to the same host and port.

4.5 — Encoded PowerShell commands and script blocks

To tie everything together an encoded PowerShell command was executed. Script block and execution events reveal how attackers hide intent while still leaving a clear trail in telemetry once decoded.

  • Executed an encoded command to simulate obfuscated payload delivery
  • Captured script block logging and related process events
  • Used these events as the core of the encoded command case in reporting
Encoded PowerShell script block

Script block view of an encoded PowerShell command later decoded and mapped to registry and network events.

Encoded PowerShell execution attempt

Execution attempt for the encoded command, providing timing and process details for reconstruction.

Key actions in this phase

  • Established normal browsing and file activity as a baseline for comparison
  • Simulated attacker behavior using LOLBins, registry persistence, and beacon style network traffic
  • Captured encoded PowerShell usage that ties process, registry, and network events into a single narrative

Phase 5 — SOC reporting and MITRE ATT&CK mapping

The final phase focuses on reporting. Each simulation is treated like a ticket: summarize what happened, list key commands and events, explain why it is suspicious, and tie it to MITRE ATT&CK. The goal is for someone who did not run the lab to understand the full incident story.

5.1 — Post exploitation discovery commands

Basic commands such as whoami and systeminfo were revisited in a post exploitation context. When viewed through Sysmon, these become part of a clear discovery phase in the overall case timeline.

  • Executed whoami and systeminfo from the attacker perspective
  • Mapped resulting process events to discovery techniques in MITRE
  • Used timing and parent child relationships to show context clearly
Post exploitation whoami

Post exploitation whoami usage, revisited as part of a broader discovery and persistence sequence.

System information discovery

systeminfo execution recorded as another process creation event, filling out the discovery phase.

5.2 — SOC style persistence case template

The persistence scenario was wrapped into a SOC style template with sections for indicators, event IDs, registry paths, payload details, and mapped techniques. This format can plug directly into a ticketing system or training material for new analysts.

  • Documented the Run key case with clear fields and notes
  • Listed the exact Sysmon event IDs that support the finding
  • Linked the activity to persistence and execution techniques in MITRE
SOC style persistence report

SOC style report template capturing the persistence payload, key Sysmon events, indicators, and MITRE mapping.

Example MITRE ATT&CK mapping from this lab

The table below summarizes how major cases in the lab map to MITRE techniques and which Sysmon events support them. This provides a bridge between low level telemetry and higher level detection strategy.

Case Technique Sysmon / Log source Detection notes
Encoded PowerShell persistence T1059.001 · PowerShell Sysmon Event ID 1 plus PowerShell script block logging Full command line and decoded script reveal suspicious encoded payload execution.
Run key persistence payload T1547.001 · Run keys Sysmon Event ID 13 Registry value set events show the Run key path and the payload configured to launch at logon.
Command and control beacon traffic T1071 · Application layer protocol Sysmon Event ID 3 plus 22 Repeated outbound connections and matching DNS queries tie the host to external control infrastructure.
Post exploitation host discovery T1082 · System information discovery Sysmon Event ID 1 Commands such as systeminfo and whoami generate process events that outline the discovery phase.

This framework can expand as more simulations are added while staying grounded in the same Sysmon and Windows telemetry used throughout the lab.

Endpoint Telemetry Overview

The Sysmon lab produced a rich stream of host level telemetry. By focusing on a small set of high value event IDs raw events were turned into clear narratives about downloads, persistence, and command and control. The overview below summarizes the monitoring footprint and how it supports investigations.

Sysmon operational log overview

Sysmon Operational log view used as the primary window into process, file, registry, and network activity.

6
Core Event IDs
Process, file, registry, DNS, network, and script activity
4
Simulated Cases
Downloads, persistence, command and control, and discovery
20+
Representative Events
Screenshots of key examples for each event type
1
Monitored Host
Single workstation treated like a production endpoint
4
Mapped Techniques
ATT&CK coverage for persistence, execution, C2, and discovery

Detection Highlights

6 KEY FINDINGS
BASELINE VALUE

A quiet, well understood baseline made it easy to see when new shells, tools, or network connections appeared on the host.

EVENT ID PRIORITIES

A small set of Sysmon event IDs covered most interesting behavior, which keeps detection rules and views simple.

PERSISTENCE SIGNAL

Registry value set events around Run keys were reliable indicators of persistence configuration and cleanup attempts.

NETWORK CONTEXT

Event ID 3 network connections combined with DNS queries made it easy to connect processes to remote hosts.

SCRIPT BLOCK LOGGING

Encoded PowerShell commands still left usable script block entries once decoded, creating a strong signal for suspicious automation.

REPORTING REUSE

SOC templates built for this lab can be reused across new cases, improving onboarding and documentation quality.

Detection and Response Strategy

Tier 1: Endpoint foundation

Objective: Keep the monitored host predictable so new activity stands out.

  • Tighten baseline Reduce background noise with tuned privacy, limited software, and consistent user habits.
  • Standardize tooling Use a known set of consoles and scripts so unexpected tools are easier to spot.
  • Document normal behavior Capture reference screenshots and logs that future investigations can compare against.

Tier 2: Telemetry and analytics

Objective: Turn raw Sysmon events into reliable detection logic.

  • Focus on key IDs Prioritize process, registry, network, DNS, and script related events for rules and hunts.
  • Build reusable views Share tuned Event Viewer filters and queries so other analysts can trace the same paths.
  • Correlate signals Link process, registry, and network events into simple chains that explain each scenario.

Tier 3: SOC workflow

Objective: Package findings in a way that fits day to day security operations.

  • Use case templates Keep persistence and C2 cases in a consistent SOC report format with indicators and notes.
  • Map to MITRE Link each scenario to techniques so playbooks and training can reference the same language.
  • Extend to SIEM The same patterns can later feed SIEM rules once logs are forwarded beyond the host.

Key insights

  • A single well instrumented endpoint can provide enough signal to reconstruct full attack stories.
  • Most of the value comes from a small group of Sysmon event IDs when they are filtered and interpreted correctly.
  • Registry and network telemetry are powerful for persistence and command and control detection when paired with process context.
  • Structured reporting and MITRE mapping are just as important as the underlying logs for SOC readiness.

Skills demonstrated

Windows Endpoint Hardening Sysmon Deployment and Tuning Event Viewer Custom Views Threat Hunting with Host Logs PowerShell Investigation Registry and Run Key Analysis Network and DNS Telemetry MITRE ATT&CK Mapping SOC Style Reporting

Summary

This Windows Sysmon lab shows the progression from a clean endpoint to a complete threat detection story. A realistic Windows 10 monitoring VM was built, Sysmon was deployed and validated, and views were tuned around high value event IDs. From there behavior ranging from normal browsing and file activity to registry persistence and command and control connections was simulated, then each scenario was rebuilt using host telemetry alone. The final deliverable is more than a set of screenshots. It is a series of SOC ready investigations tied to specific Sysmon events and mapped to MITRE ATT&CK. This project demonstrates practical experience with Windows telemetry, threat hunting, and clear written communication of findings, all of which are core skills for an entry level security analyst.